> ## Documentation Index
> Fetch the complete documentation index at: https://help.experro.com/llms.txt
> Use this file to discover all available pages before exploring further.
# Experience Analytics
Alongside **Traffic** and **Metrics**, the results screen shows one tab for each experience type in the experiment. Each tab starts with a selector so you can choose which page, component, algorithm, or rule to examine.
## Web Page
Summary tiles cover **Total Visitors**, **New Visitors**, **Returning Visitors**, **Average Time on Page**, **Total Page Views**, **Unique Page Views**, **Exit Rate**, and **Bounce Rate**.
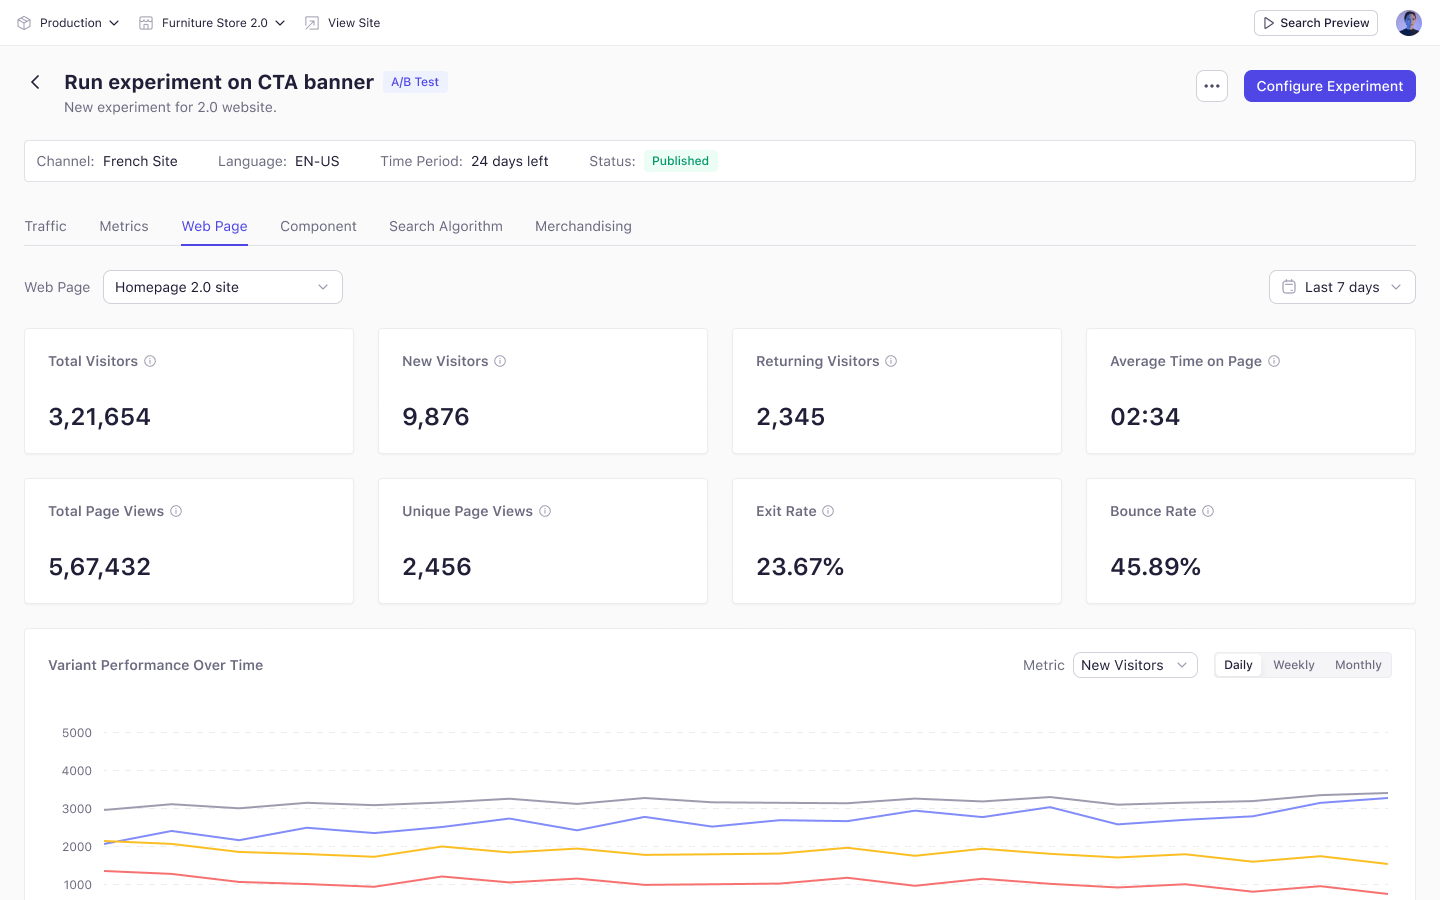 Below the tiles:
* **Variant Performance Over Time** — a chart for any tile metric, at daily, weekly, or monthly granularity.
* **Metrics by Variant** — every tile metric broken out by group.
* **Visitor by Device**, **Traffic by Location**, and **Traffic by Browser** — distributions per group.
A few definitions worth knowing:
| Metric | How it is measured |
| ------------------------ | ------------------------------------------ |
| **Returning Visitors** | Total visitors minus new visitors |
| **Exit Rate** | Share of page views that ended the session |
| **Bounce Rate** | Share of page leaves under ten seconds |
| **Average Time on Page** | Total time on page divided by page leaves |
## Component
Summary tiles cover **Component Impressions**, **Component Clicks**, and **Interaction Rate**, where interaction rate is clicks divided by impressions.
The tab also breaks these out by variant, device, location, and browser.
## Search Algorithm
Summary tiles cover **Search Views**, **Search Clicks**, **CTR**, **Add to Cart Rate**, **Total Orders**, **Avg. Order Value**, and **Total Search Revenue**.
Below them sit a variant performance chart, a metrics-by-variant table, and a traffic-by-device table.
## Merchandising
Summary tiles cover **Product Impressions**, **Product Clicks**, **Add to Cart Rate**, **Conversion Rate**, **Merchandising Revenue**, **Avg. Order Value**, and **Rule Hit Count**.
Below them sit a variant performance chart and a metrics-by-variant table.
## Key Considerations
* Tabs appear only for experience types included in the experiment.
* The duration selector at the top applies across every tab.
* Personalization experiments use the same layout without control group columns.
Experience tabs describe how a specific page or rule performed. Use them to explain a result, not to decide the winner — that decision belongs to the primary metric on the **Metrics** tab.
## What's Next
* [View Experiment Results](/experiments/analytics/overview)
* [End an Experiment](/experiments/managing_experiments/end_an_experiment)
Below the tiles:
* **Variant Performance Over Time** — a chart for any tile metric, at daily, weekly, or monthly granularity.
* **Metrics by Variant** — every tile metric broken out by group.
* **Visitor by Device**, **Traffic by Location**, and **Traffic by Browser** — distributions per group.
A few definitions worth knowing:
| Metric | How it is measured |
| ------------------------ | ------------------------------------------ |
| **Returning Visitors** | Total visitors minus new visitors |
| **Exit Rate** | Share of page views that ended the session |
| **Bounce Rate** | Share of page leaves under ten seconds |
| **Average Time on Page** | Total time on page divided by page leaves |
## Component
Summary tiles cover **Component Impressions**, **Component Clicks**, and **Interaction Rate**, where interaction rate is clicks divided by impressions.
The tab also breaks these out by variant, device, location, and browser.
## Search Algorithm
Summary tiles cover **Search Views**, **Search Clicks**, **CTR**, **Add to Cart Rate**, **Total Orders**, **Avg. Order Value**, and **Total Search Revenue**.
Below them sit a variant performance chart, a metrics-by-variant table, and a traffic-by-device table.
## Merchandising
Summary tiles cover **Product Impressions**, **Product Clicks**, **Add to Cart Rate**, **Conversion Rate**, **Merchandising Revenue**, **Avg. Order Value**, and **Rule Hit Count**.
Below them sit a variant performance chart and a metrics-by-variant table.
## Key Considerations
* Tabs appear only for experience types included in the experiment.
* The duration selector at the top applies across every tab.
* Personalization experiments use the same layout without control group columns.
Experience tabs describe how a specific page or rule performed. Use them to explain a result, not to decide the winner — that decision belongs to the primary metric on the **Metrics** tab.
## What's Next
* [View Experiment Results](/experiments/analytics/overview)
* [End an Experiment](/experiments/managing_experiments/end_an_experiment)