> ## Documentation Index
> Fetch the complete documentation index at: https://help.experro.com/llms.txt
> Use this file to discover all available pages before exploring further.
# View Experiment Results
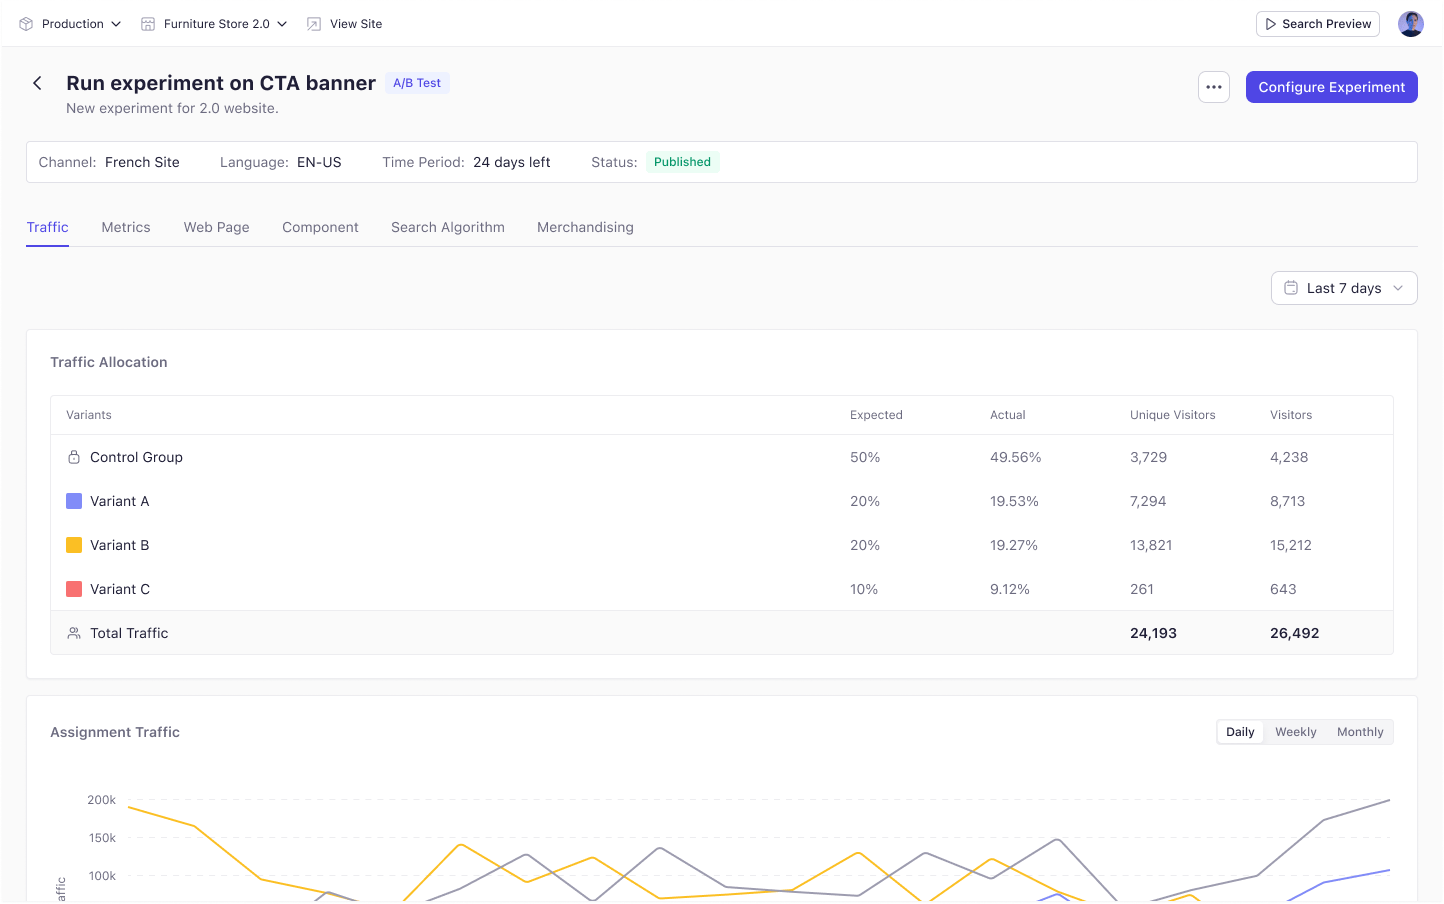
Opening an experiment shows its results screen. A summary bar sits above a set of tabs — **Traffic** and **Metrics** always, plus one tab for each experience type in the experiment.
## The Summary Bar
| Element | What it shows |
| --------------- | ------------------------------------------------- |
| **Channel** | The channel the experiment runs on |
| **Language** | The language the experiment runs in |
| **Time Period** | Days remaining until the end date |
| **Status** | Draft, Scheduled, Published, Paused, or Completed |
**Time Period** shows `∞ days` when no end date is set, and is hidden while the experiment is a draft.
Ending an experiment early freezes both readings. An experiment ended with two days left permanently shows "2 days left" — a record of how early you stopped it.
## Traffic Tab
**Traffic Allocation** compares the split you configured against what actually happened.
| Column | Meaning |
| ------------------- | ------------------------------ |
| **Expected** | The percentage you configured |
| **Actual** | The percentage actually served |
| **Unique Visitors** | Distinct people |
| **Visitors** | Total visits |
Small gaps between expected and actual are normal. Large or persistent gaps are worth investigating before you trust the results.
Below it, **Assigned Traffic** plots each group's share over time.
 ## Metrics Tab
Metrics are split into **Primary Metrics** and **Secondary Metrics**, each showing one row per group.
| Column | Meaning |
| ----------------------- | ----------------------------------------- |
| **Traffic Split** | The share of traffic this group received |
| **Conversion/Visitors** | Conversions against visitors measured |
| **Expected Conversion** | The conversion rate for this group |
| **Improvement** | Relative change against the control group |
The control group is marked with a lock icon and reads `Baseline` in every improvement column. Each variant is measured against it.
**Lift** is the relative improvement of a variant over the control, calculated as `((VariantMetric - ControlMetric) / ControlMetric) * 100`.
Below the tables, **Metrics Over Time** plots a selected metric for every group.
Judge the winner on the primary metric. Secondary metrics tell you whether the win came at a cost elsewhere.
Resist reading results in the first days of a test. Early numbers swing widely, and a variant that looks ahead on day two often finishes behind.
## What's Next
* [Experience Analytics](/experiments/analytics/experience_analytics)
* [End an Experiment](/experiments/managing_experiments/end_an_experiment)
## Metrics Tab
Metrics are split into **Primary Metrics** and **Secondary Metrics**, each showing one row per group.
| Column | Meaning |
| ----------------------- | ----------------------------------------- |
| **Traffic Split** | The share of traffic this group received |
| **Conversion/Visitors** | Conversions against visitors measured |
| **Expected Conversion** | The conversion rate for this group |
| **Improvement** | Relative change against the control group |
The control group is marked with a lock icon and reads `Baseline` in every improvement column. Each variant is measured against it.
**Lift** is the relative improvement of a variant over the control, calculated as `((VariantMetric - ControlMetric) / ControlMetric) * 100`.
Below the tables, **Metrics Over Time** plots a selected metric for every group.
Judge the winner on the primary metric. Secondary metrics tell you whether the win came at a cost elsewhere.
Resist reading results in the first days of a test. Early numbers swing widely, and a variant that looks ahead on day two often finishes behind.
## What's Next
* [Experience Analytics](/experiments/analytics/experience_analytics)
* [End an Experiment](/experiments/managing_experiments/end_an_experiment)