> ## Documentation Index
> Fetch the complete documentation index at: https://help.experro.com/llms.txt
> Use this file to discover all available pages before exploring further.
# Products
The Products dashboard reports on per-product performance — which products are converting, which aren't, and what shoppers are searching for when they encounter (or fail to encounter) each product.
## How to Use Products
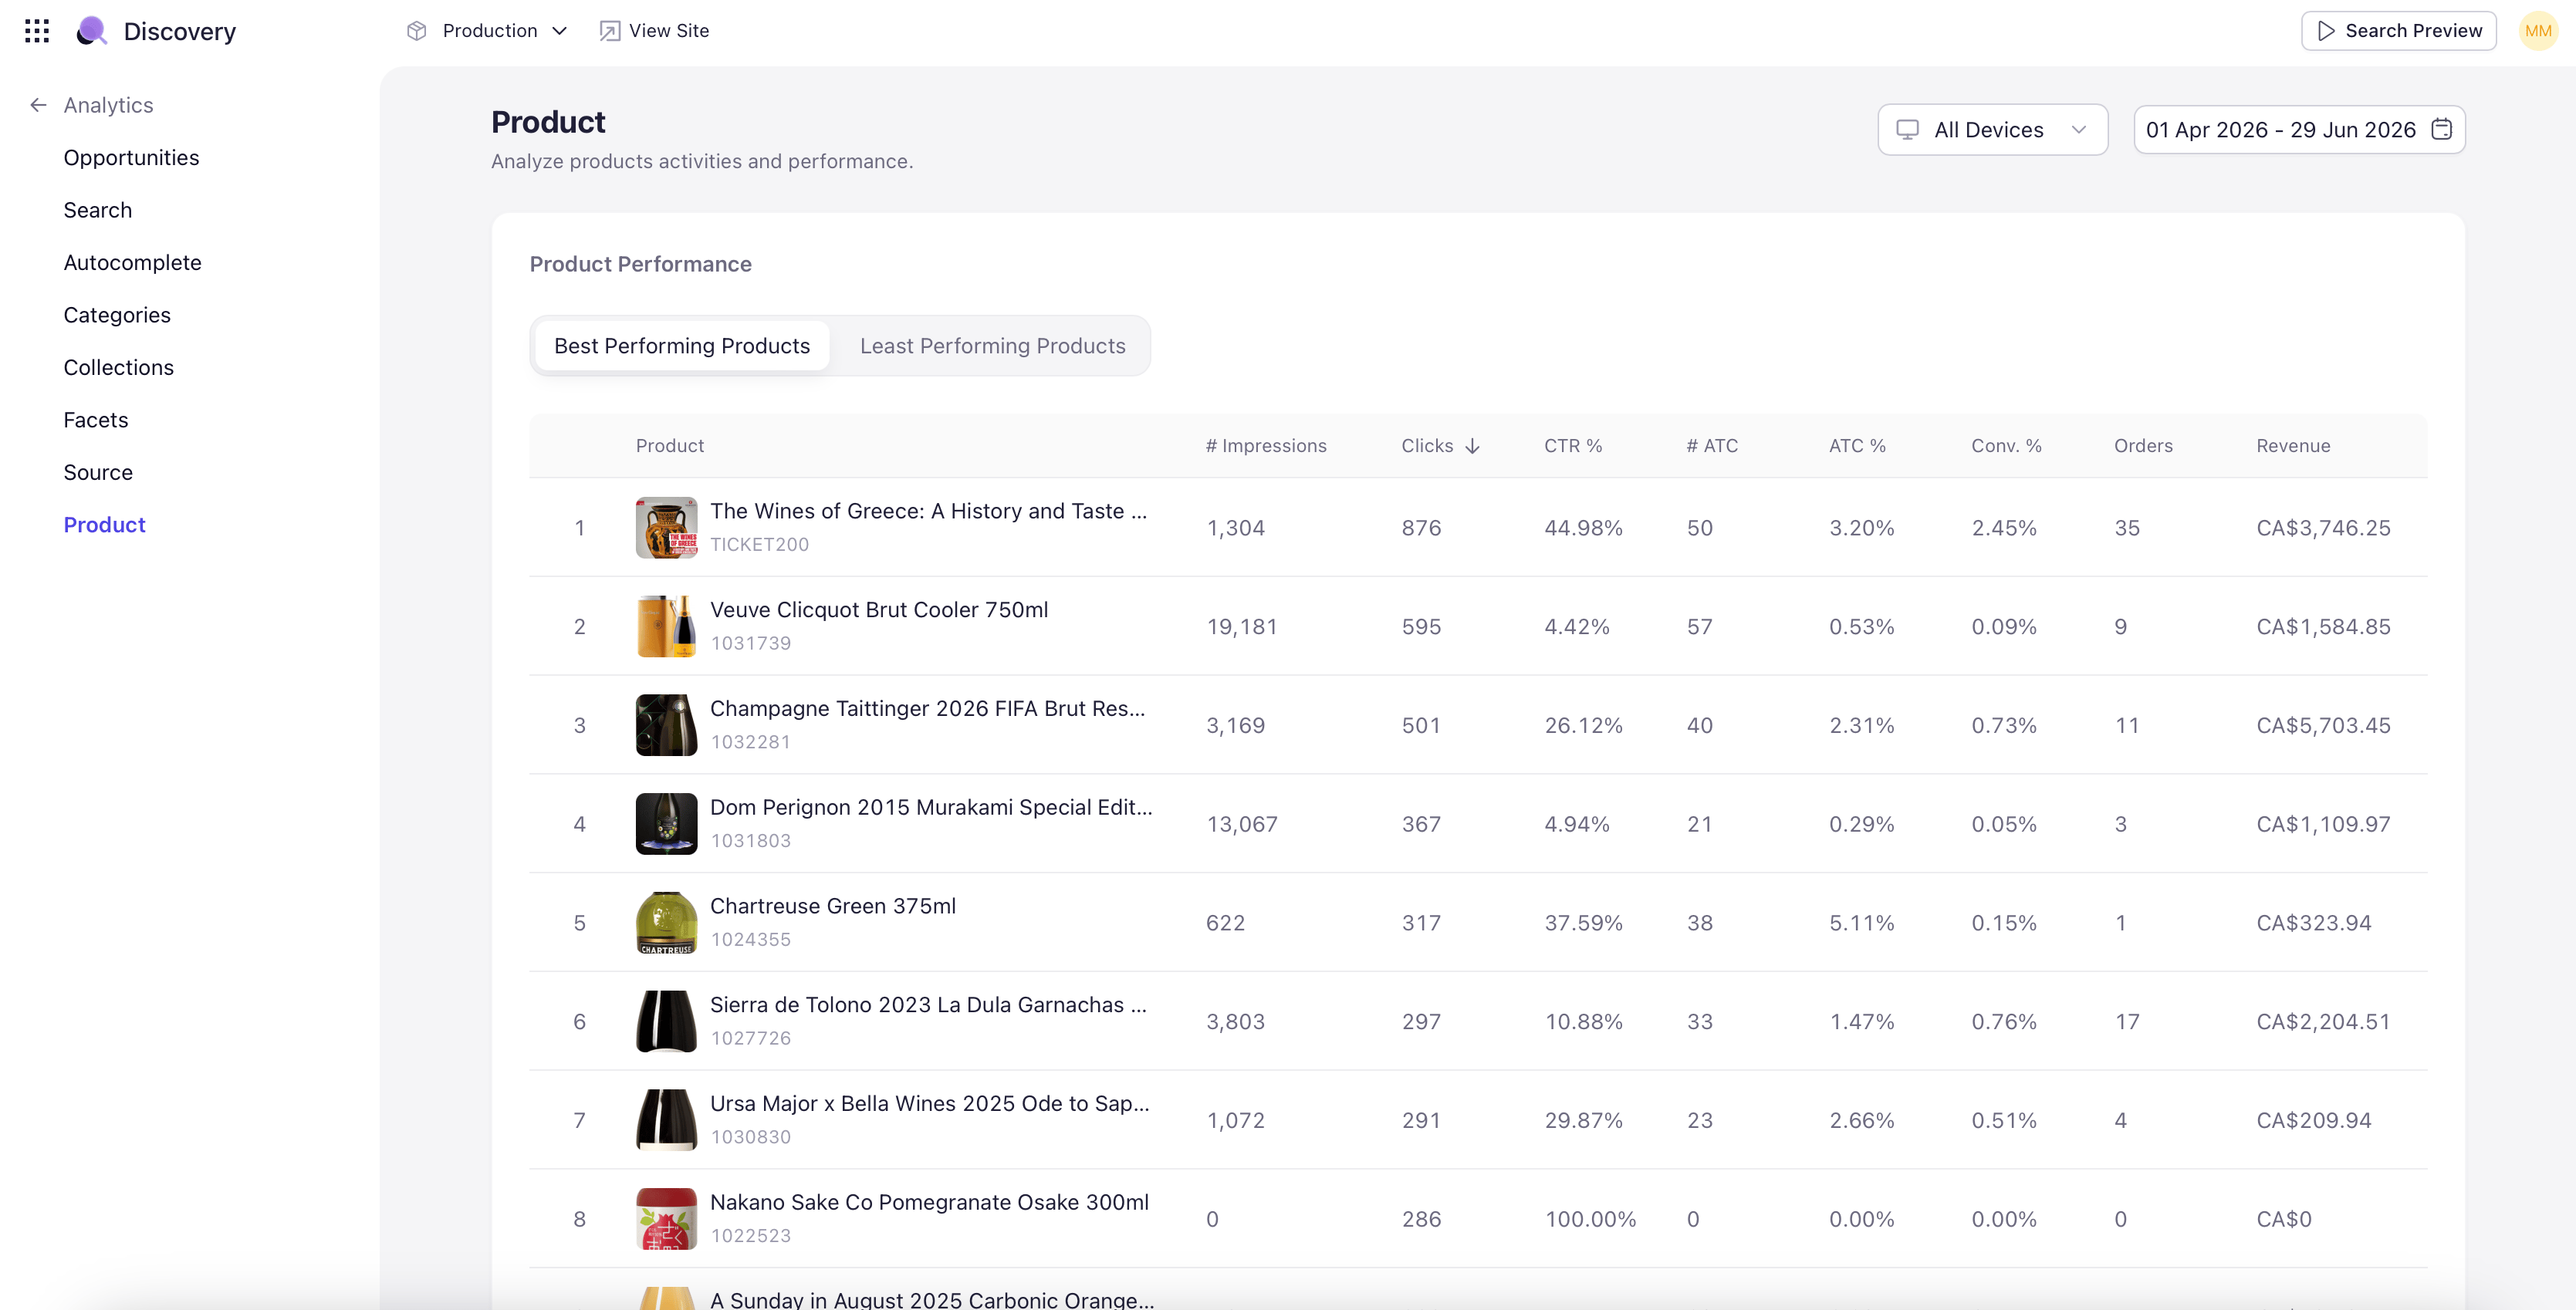
Navigate to the Analytics section and select Products from the left navigation. Set the site, device, date range, and comparison period from the controls in the upper right.
The dashboard opens with two top-level tabs — Best Performing Products and Least Performing Products — and a unified product-performance table that supports sorting by any column. Use it as the bridge between catalog operations and merchandising decisions.
## Best Performing and Least Performing Tabs
Best Performing Products ranks products by performance with views, CTR, add-to-cart count, total orders, and total revenue. Use this tab to identify your hero SKUs and protect their visibility through merchandising rules.
Least Performing Products is the inverse. The bottom of the ranking is usually a mix of new launches that haven't accumulated history yet, inventory-constrained SKUs, and genuinely underperforming products that need merchandising attention or removal.
## Searches with No Impressions and High Impressions
A second section below the main table bridges search and catalog:
* **Searches with No Impressions** — Searches that occurred but did not return any impression for the product in context. These are missed-discovery moments — either a synonym gap, a relevance issue, or a catalog gap.
* **Searches with High Impressions** — Searches that produced many impressions for the product but did not convert. Often signals a relevance mismatch (the product is showing up but not for the right intent) or a creative issue (the listing image or title is not persuading clicks).
## Per-Product Drilldown
Clicking any product opens a per-product dashboard showing the product's full performance picture. The drilldown header shows the product image and name; below it sits a grid of KPI tiles:
* Total Searches that surfaced the product.
* Total Views the product received.
* Total Carts (add-to-cart events).
* Total Orders.
* Cart-to-Order Rate.
* Click-to-Cart Rate.
* Cart Rate.
* Search Conversion Rate.
* Total Revenue.
Below the KPIs, a Product Performance section breaks down the traffic that drove the product. The Popular Search Keywords sub-tab lists search terms that most often surfaced this product, with searches, clicks, CTR, add-to-cart, orders, and revenue per term. The Popular Categories sub-tab does the same for category pages where the product appeared.
Recent Visits and Sessions section at the bottom of the page shows recent shopper activity involving the product — useful for spot-checking unusual behavior and for customer-service investigations.
 ## Best Performing and Least Performing Tabs
Best Performing Products ranks products by performance with views, CTR, add-to-cart count, total orders, and total revenue. Use this tab to identify your hero SKUs and protect their visibility through merchandising rules.
Least Performing Products is the inverse. The bottom of the ranking is usually a mix of new launches that haven't accumulated history yet, inventory-constrained SKUs, and genuinely underperforming products that need merchandising attention or removal.
## Searches with No Impressions and High Impressions
A second section below the main table bridges search and catalog:
* **Searches with No Impressions** — Searches that occurred but did not return any impression for the product in context. These are missed-discovery moments — either a synonym gap, a relevance issue, or a catalog gap.
* **Searches with High Impressions** — Searches that produced many impressions for the product but did not convert. Often signals a relevance mismatch (the product is showing up but not for the right intent) or a creative issue (the listing image or title is not persuading clicks).
## Per-Product Drilldown
Clicking any product opens a per-product dashboard showing the product's full performance picture. The drilldown header shows the product image and name; below it sits a grid of KPI tiles:
* Total Searches that surfaced the product.
* Total Views the product received.
* Total Carts (add-to-cart events).
* Total Orders.
* Cart-to-Order Rate.
* Click-to-Cart Rate.
* Cart Rate.
* Search Conversion Rate.
* Total Revenue.
Below the KPIs, a Product Performance section breaks down the traffic that drove the product. The Popular Search Keywords sub-tab lists search terms that most often surfaced this product, with searches, clicks, CTR, add-to-cart, orders, and revenue per term. The Popular Categories sub-tab does the same for category pages where the product appeared.
Recent Visits and Sessions section at the bottom of the page shows recent shopper activity involving the product — useful for spot-checking unusual behavior and for customer-service investigations.
## Best Performing and Least Performing Tabs
Best Performing Products ranks products by performance with views, CTR, add-to-cart count, total orders, and total revenue. Use this tab to identify your hero SKUs and protect their visibility through merchandising rules.
Least Performing Products is the inverse. The bottom of the ranking is usually a mix of new launches that haven't accumulated history yet, inventory-constrained SKUs, and genuinely underperforming products that need merchandising attention or removal.
## Searches with No Impressions and High Impressions
A second section below the main table bridges search and catalog:
* **Searches with No Impressions** — Searches that occurred but did not return any impression for the product in context. These are missed-discovery moments — either a synonym gap, a relevance issue, or a catalog gap.
* **Searches with High Impressions** — Searches that produced many impressions for the product but did not convert. Often signals a relevance mismatch (the product is showing up but not for the right intent) or a creative issue (the listing image or title is not persuading clicks).
## Per-Product Drilldown
Clicking any product opens a per-product dashboard showing the product's full performance picture. The drilldown header shows the product image and name; below it sits a grid of KPI tiles:
* Total Searches that surfaced the product.
* Total Views the product received.
* Total Carts (add-to-cart events).
* Total Orders.
* Cart-to-Order Rate.
* Click-to-Cart Rate.
* Cart Rate.
* Search Conversion Rate.
* Total Revenue.
Below the KPIs, a Product Performance section breaks down the traffic that drove the product. The Popular Search Keywords sub-tab lists search terms that most often surfaced this product, with searches, clicks, CTR, add-to-cart, orders, and revenue per term. The Popular Categories sub-tab does the same for category pages where the product appeared.
Recent Visits and Sessions section at the bottom of the page shows recent shopper activity involving the product — useful for spot-checking unusual behavior and for customer-service investigations.