> ## Documentation Index
> Fetch the complete documentation index at: https://help.experro.com/llms.txt
> Use this file to discover all available pages before exploring further.
# Search
The Search dashboard reports on search behavior end-to-end — how often shoppers search, what they search for, what results they see, and how those searches convert.
## How to Use Search
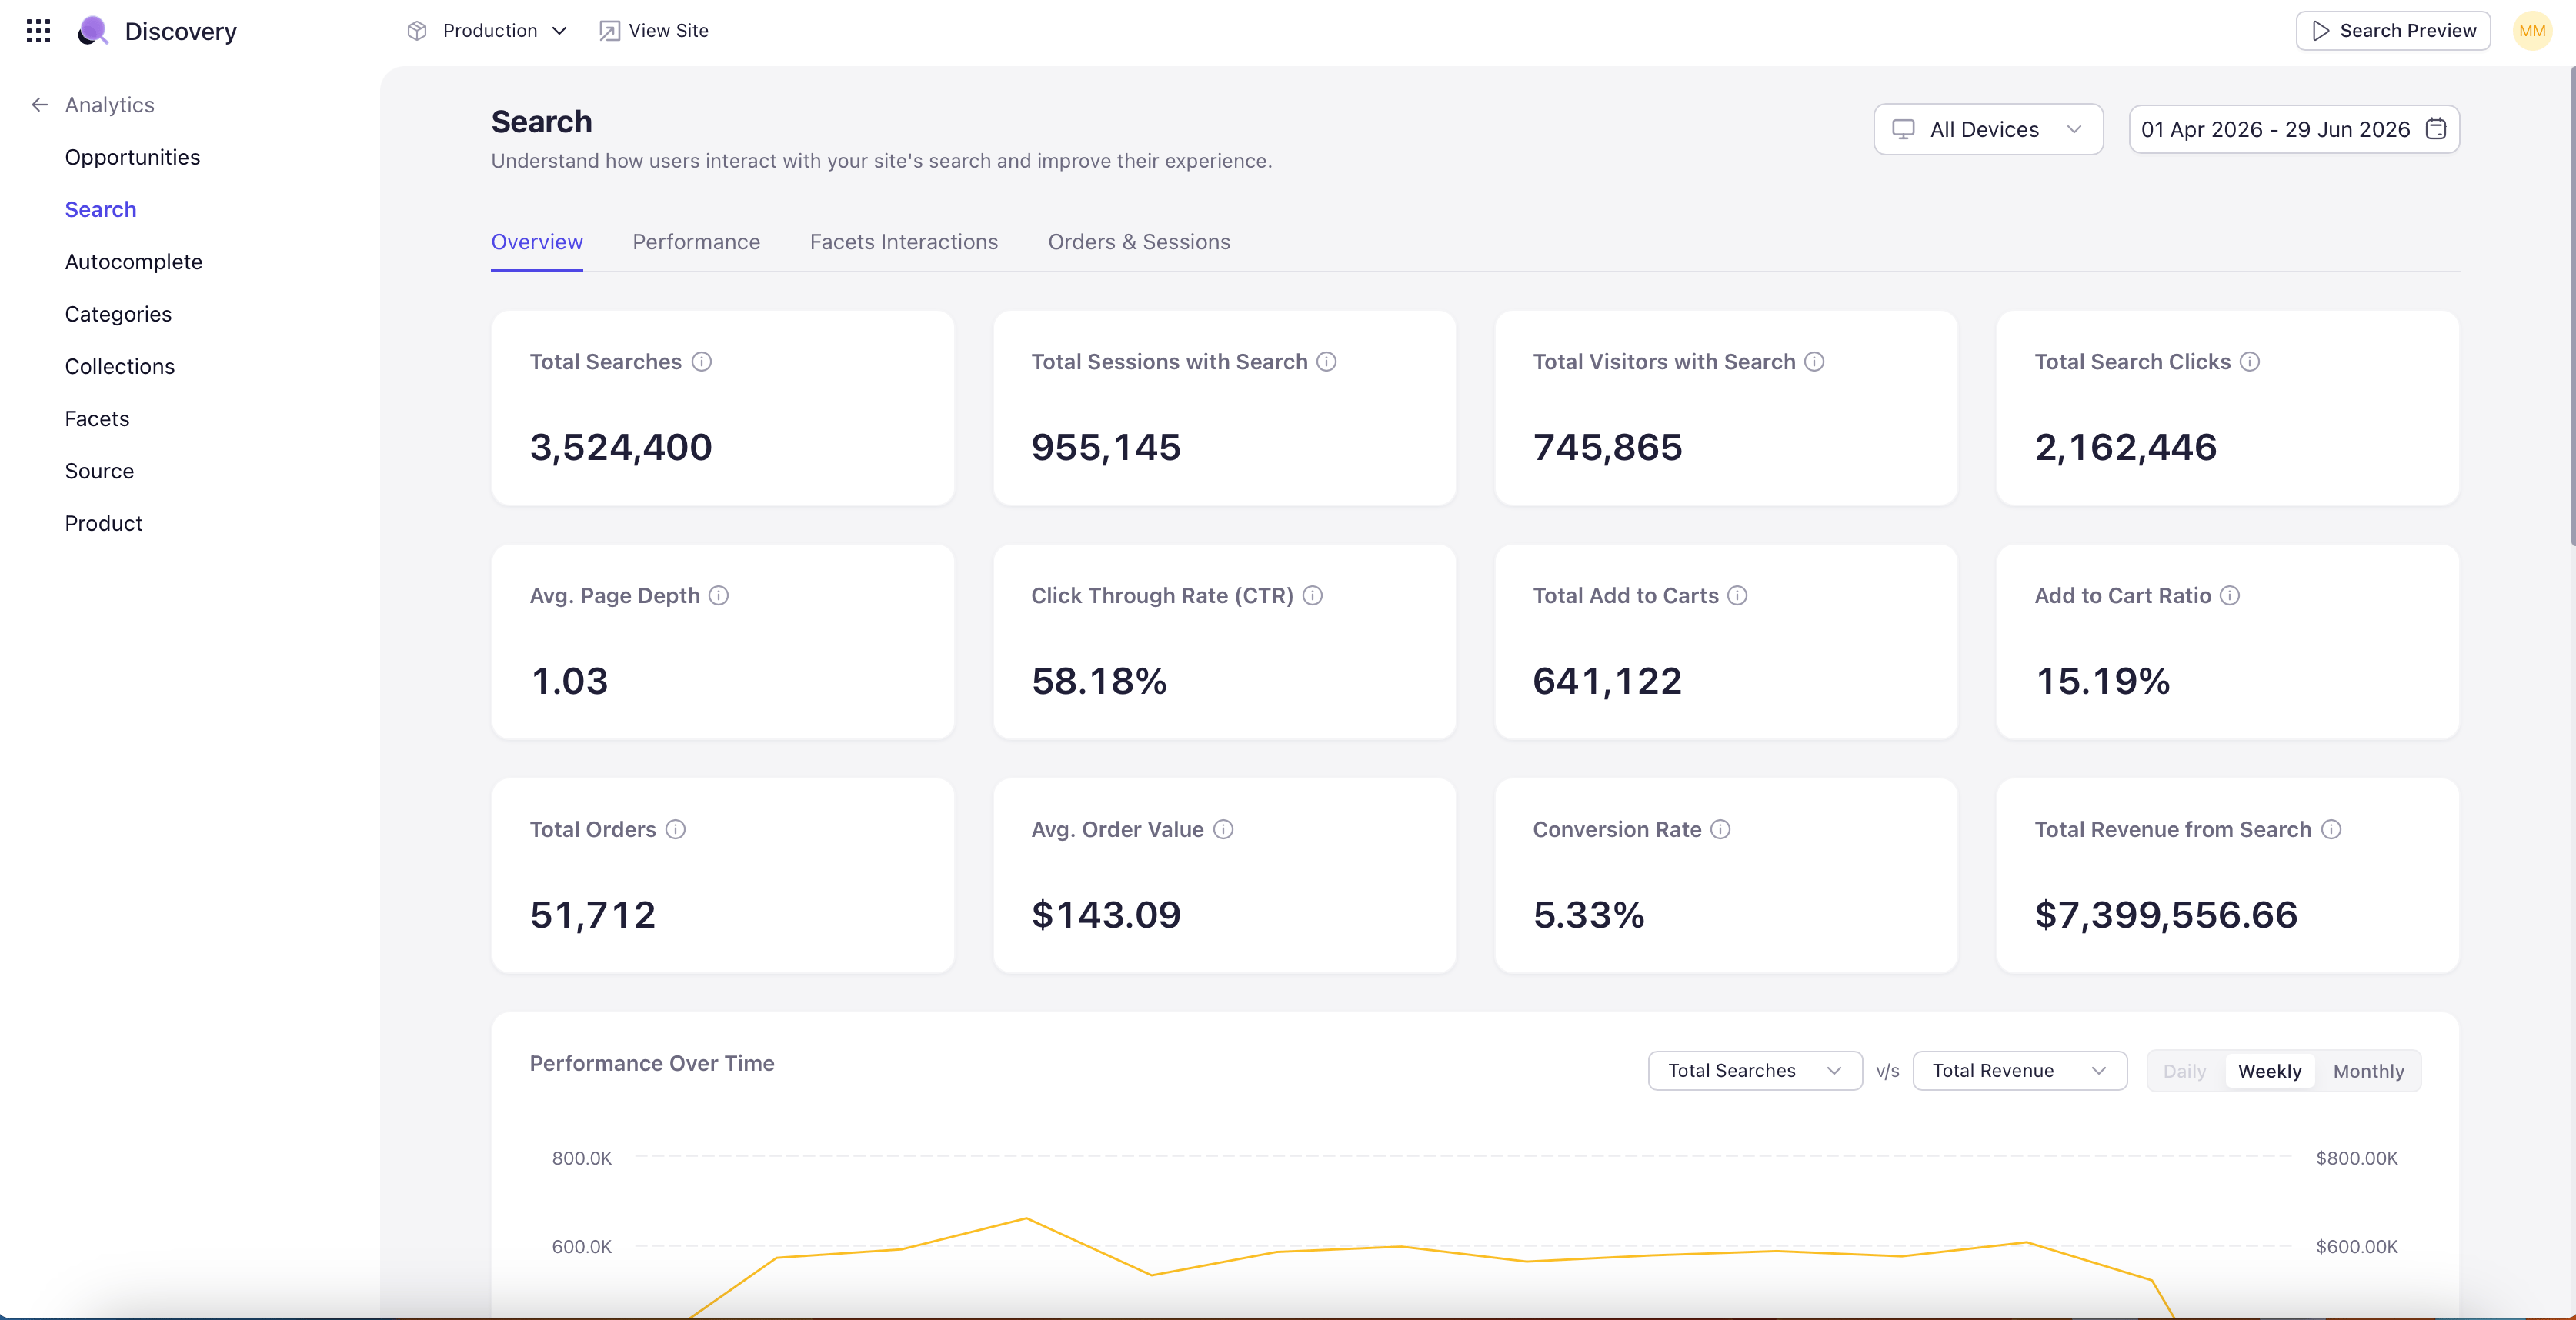
Navigate to the Analytics section and select Search from the left navigation. Set the site, device, date range, and comparison period from the controls in the upper right.
The dashboard opens with KPI tiles at the top covering the search funnel — total search volume, click-through, add-to-cart, conversion, and revenue. Each tile shows the absolute value for the selected period and, when Compare is on, the percentage change against the comparison period.
 ## Search Conversion Funnel
Below the KPI tiles, a funnel visualization shows how shoppers move from search to click to add-to-cart to order. Hover any stage of the funnel to see the absolute count and the stage-over-stage conversion rate. The drop-off between any two stages is the leak to investigate first.
## Performance Over Time
A trend chart plots search volume and conversion across the selected date range. Useful for spotting seasonal patterns, post-launch volatility, or the impact of recent merchandising changes. When Compare is on, the comparison period is overlaid on the same axes for direct visual reference.
## Search Term Tables
Below the funnel and trend chart, the dashboard surfaces search terms in several ranked lists:
* **Top Searched Terms** — Highest-volume queries during the period. The terms that matter most by sheer traffic.
* **Top Converting Searches** — Searches with the highest conversion rate. These are queries to over-invest in — protect their merchandising, ensure inventory, monitor for relevance regressions.
* **Top Revenue Generating Searches** — Searches that drove the most revenue. Often overlaps with Top Converting but weighted by basket size.
Click any search term to open a query-specific drilldown with full performance history for that one term — including the products it returned, the click-throughs it generated, and the conversion path of the resulting sessions.
## Search Conversion Funnel
Below the KPI tiles, a funnel visualization shows how shoppers move from search to click to add-to-cart to order. Hover any stage of the funnel to see the absolute count and the stage-over-stage conversion rate. The drop-off between any two stages is the leak to investigate first.
## Performance Over Time
A trend chart plots search volume and conversion across the selected date range. Useful for spotting seasonal patterns, post-launch volatility, or the impact of recent merchandising changes. When Compare is on, the comparison period is overlaid on the same axes for direct visual reference.
## Search Term Tables
Below the funnel and trend chart, the dashboard surfaces search terms in several ranked lists:
* **Top Searched Terms** — Highest-volume queries during the period. The terms that matter most by sheer traffic.
* **Top Converting Searches** — Searches with the highest conversion rate. These are queries to over-invest in — protect their merchandising, ensure inventory, monitor for relevance regressions.
* **Top Revenue Generating Searches** — Searches that drove the most revenue. Often overlaps with Top Converting but weighted by basket size.
Click any search term to open a query-specific drilldown with full performance history for that one term — including the products it returned, the click-throughs it generated, and the conversion path of the resulting sessions.