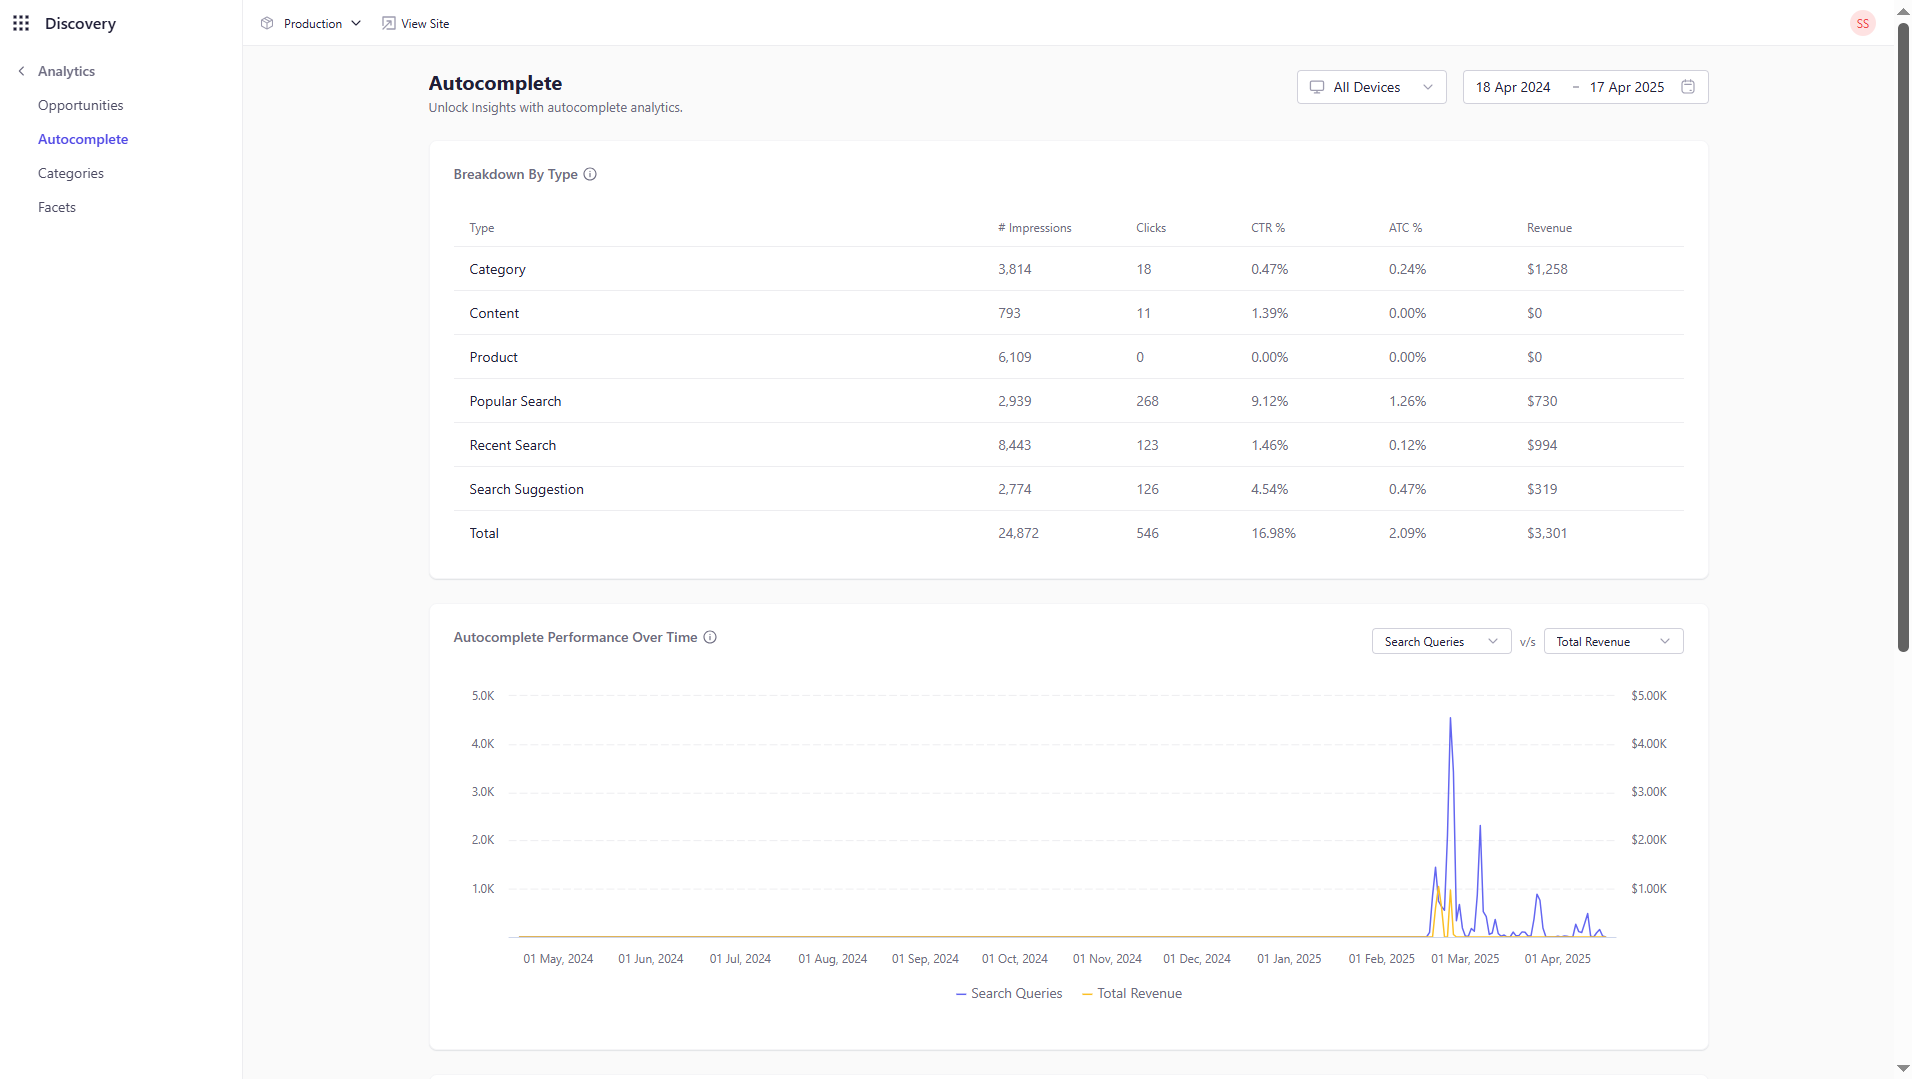
Autocomplete Analytics
This dashboard focuses on the performance of the Autocomplete feature:- Breakdown by Type: Analyze the distribution of different autocomplete suggestion types, such as by products, categories, recent search etc.
- Performance Over Time: Monitor how user interactions with autocomplete suggestions evolve over selected timeframes.
- Top Selected Suggestions: Identify the most frequently chosen autocomplete options to understand user preferences.
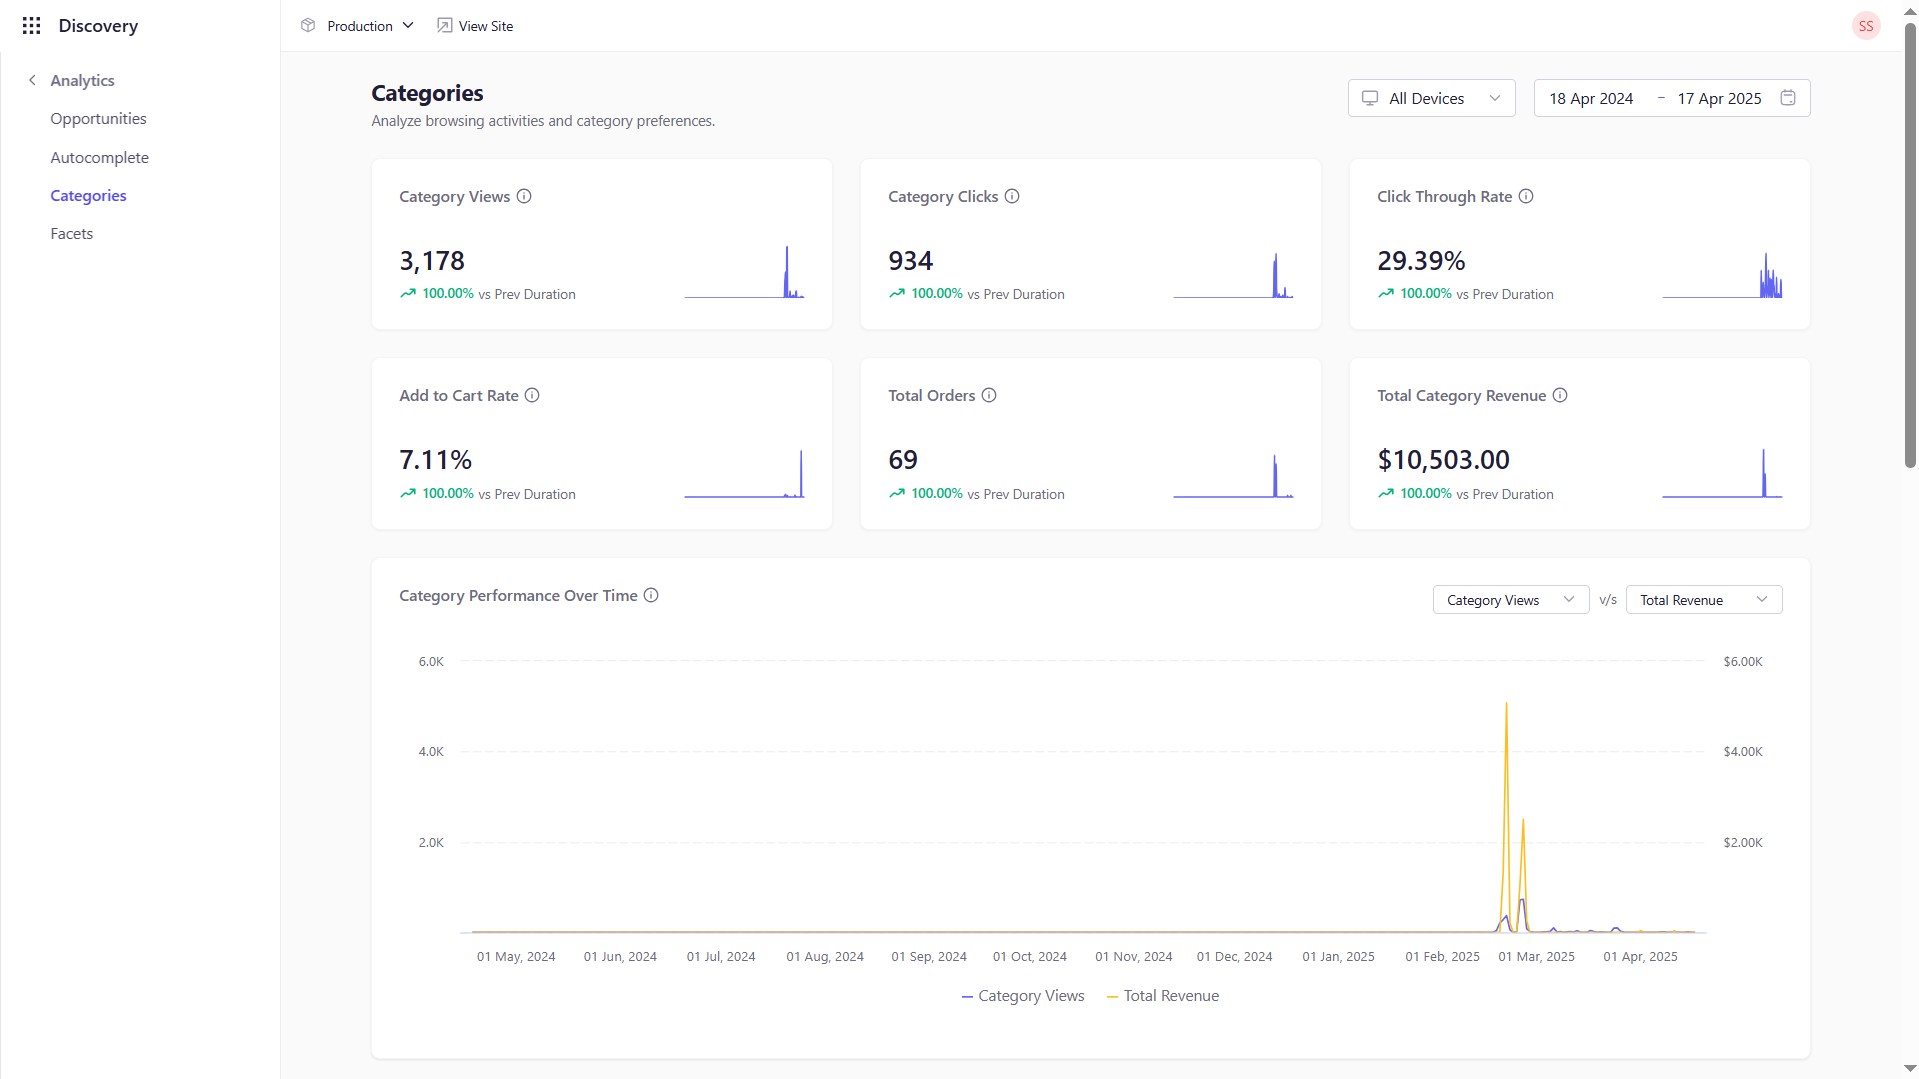
Category Analytics
The Category Analytics dashboard offers insights into the performance of individual product categories:- Category Views and Clicks: Measure how often category pages are viewed and interacted with.
- CTR and Add to Cart Rate: Evaluate the effectiveness of category pages in driving user actions.
- Total Orders and Revenue: Analyze orders and revenue generated from each category.
- Performance Over Time: Track trends in category performance.
- Conversion Funnel: Visualize the customer journey from category view to purchase.
- Device Breakdown: Understand how different devices influence category performance.
- Top Categories: Identify which categories are the most popular.
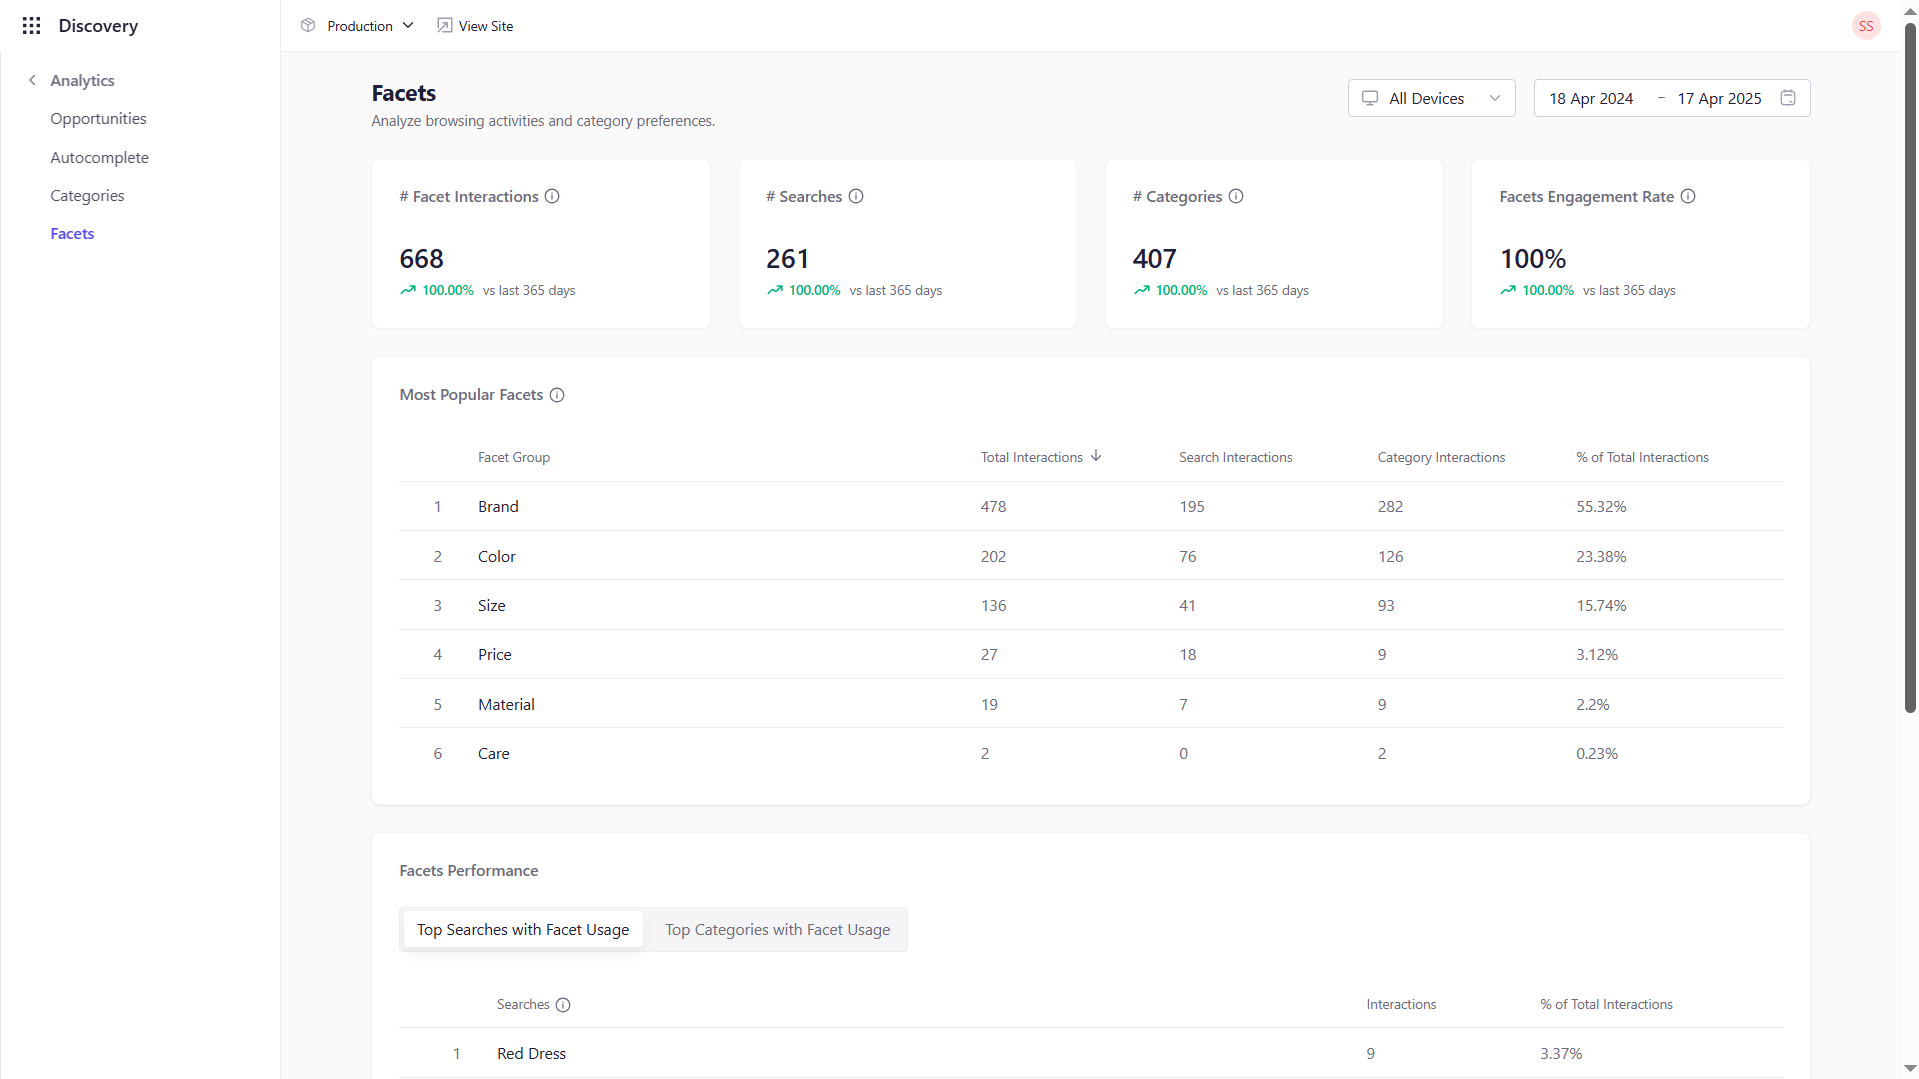
Facet Analytics
The Facet Analytics dashboard focuses on user interactions with facet filters:- Facet Interactions: Track how frequently users interact with facets.
- Searches Involving Facets: Monitor the number of searches that use facet filters.
- Category-Level Analysis: Evaluate facet usage across different product categories.
- Facet Engagement Rate: Measure the percentage of users interacting with facets.
- Most Popular Facets: Identify which facets are most commonly used.
- Overall Facet Performance: Review aggregate performance metrics for facet filters.