Overview
The Overview panel gives you a high-level snapshot of overall engagement and top performers:-
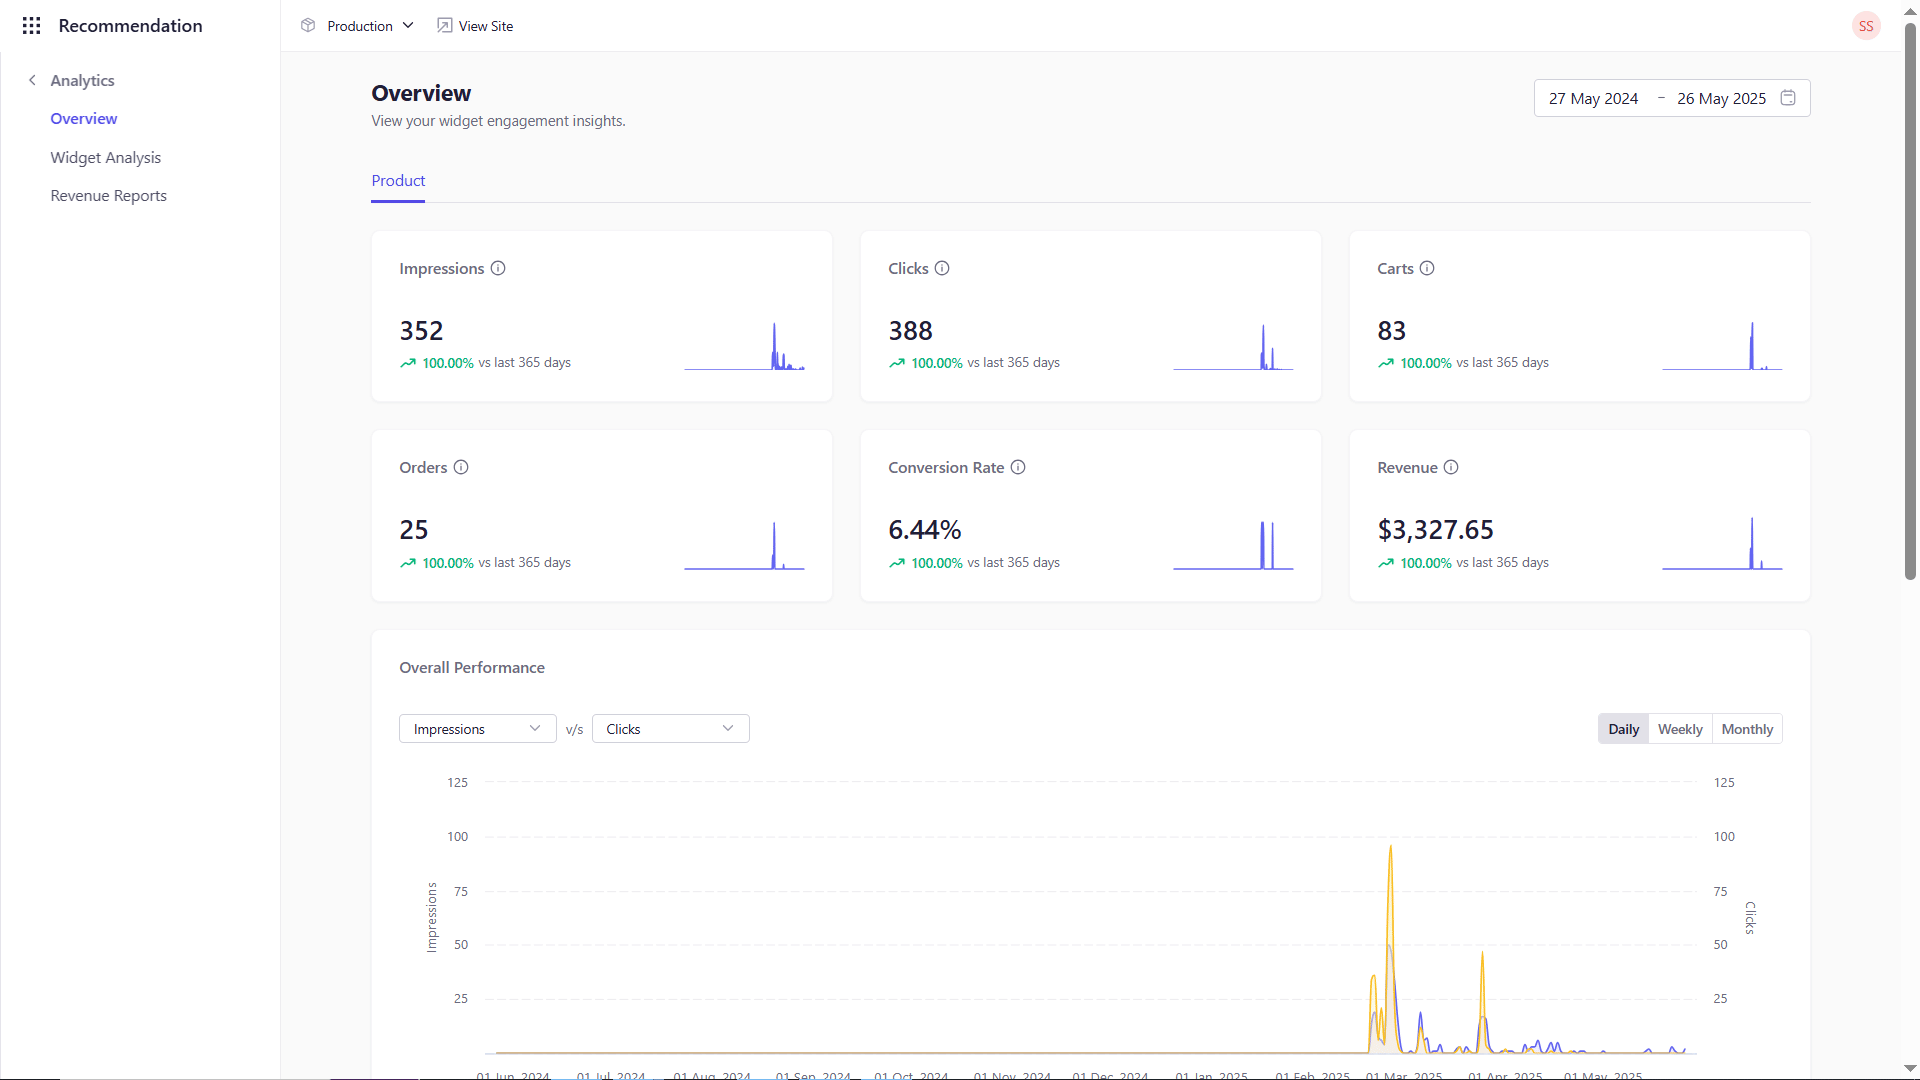
Key Metrics
- Impressions: Total times recommendation widgets were shown
- Clicks: Number of widget clicks
- Add-to-Cart: Items added to cart via a recommendation
- Orders: Completed orders originating from a recommendation
- Conversion Rate: Represents the percentage of views of recommended products that resulted in actual orders.
- Revenue: Gross sales attributed to recommendations
-
Configurable Time Series Graph
Select any two metrics (e.g. Impressions vs. Revenue, Orders vs. Clicks) for the X- and Y-axes to spot trends over your chosen time window. -
Top Widgets
A list of your highest-engaged recommendation widgets by impressions, clicks, or conversion. -
Top Products
Your best-performing SKUs across all widgets, ranked by revenue.
Widget Analysis
This section represents a deep dive into the performance of individual widgets. See widget-level impressions, clicks, carts, orders, conversion rate, and revenue in a compact summary.Revenue Reports
Measure the true business impact of your recommendations:- Revenue Represents the total amount generated from the orders placed by shoppers.
-
Direct Revenue
Represents the amount generated from the orders placed by shoppers without recommendation. -
Recommendation Revenue
Sum of all sales driven by recommendation widgets. -
Revenue Trend Chart
A time series plotting Direct Revenue and Recommendation Revenue to visualize how recommendations contribute over time. -
Top Revenue-Generating Widgets
A ranked list of widgets by total revenue, letting you quickly identify your highest-ROI placements and algorithms.