Dashboards at a Glance
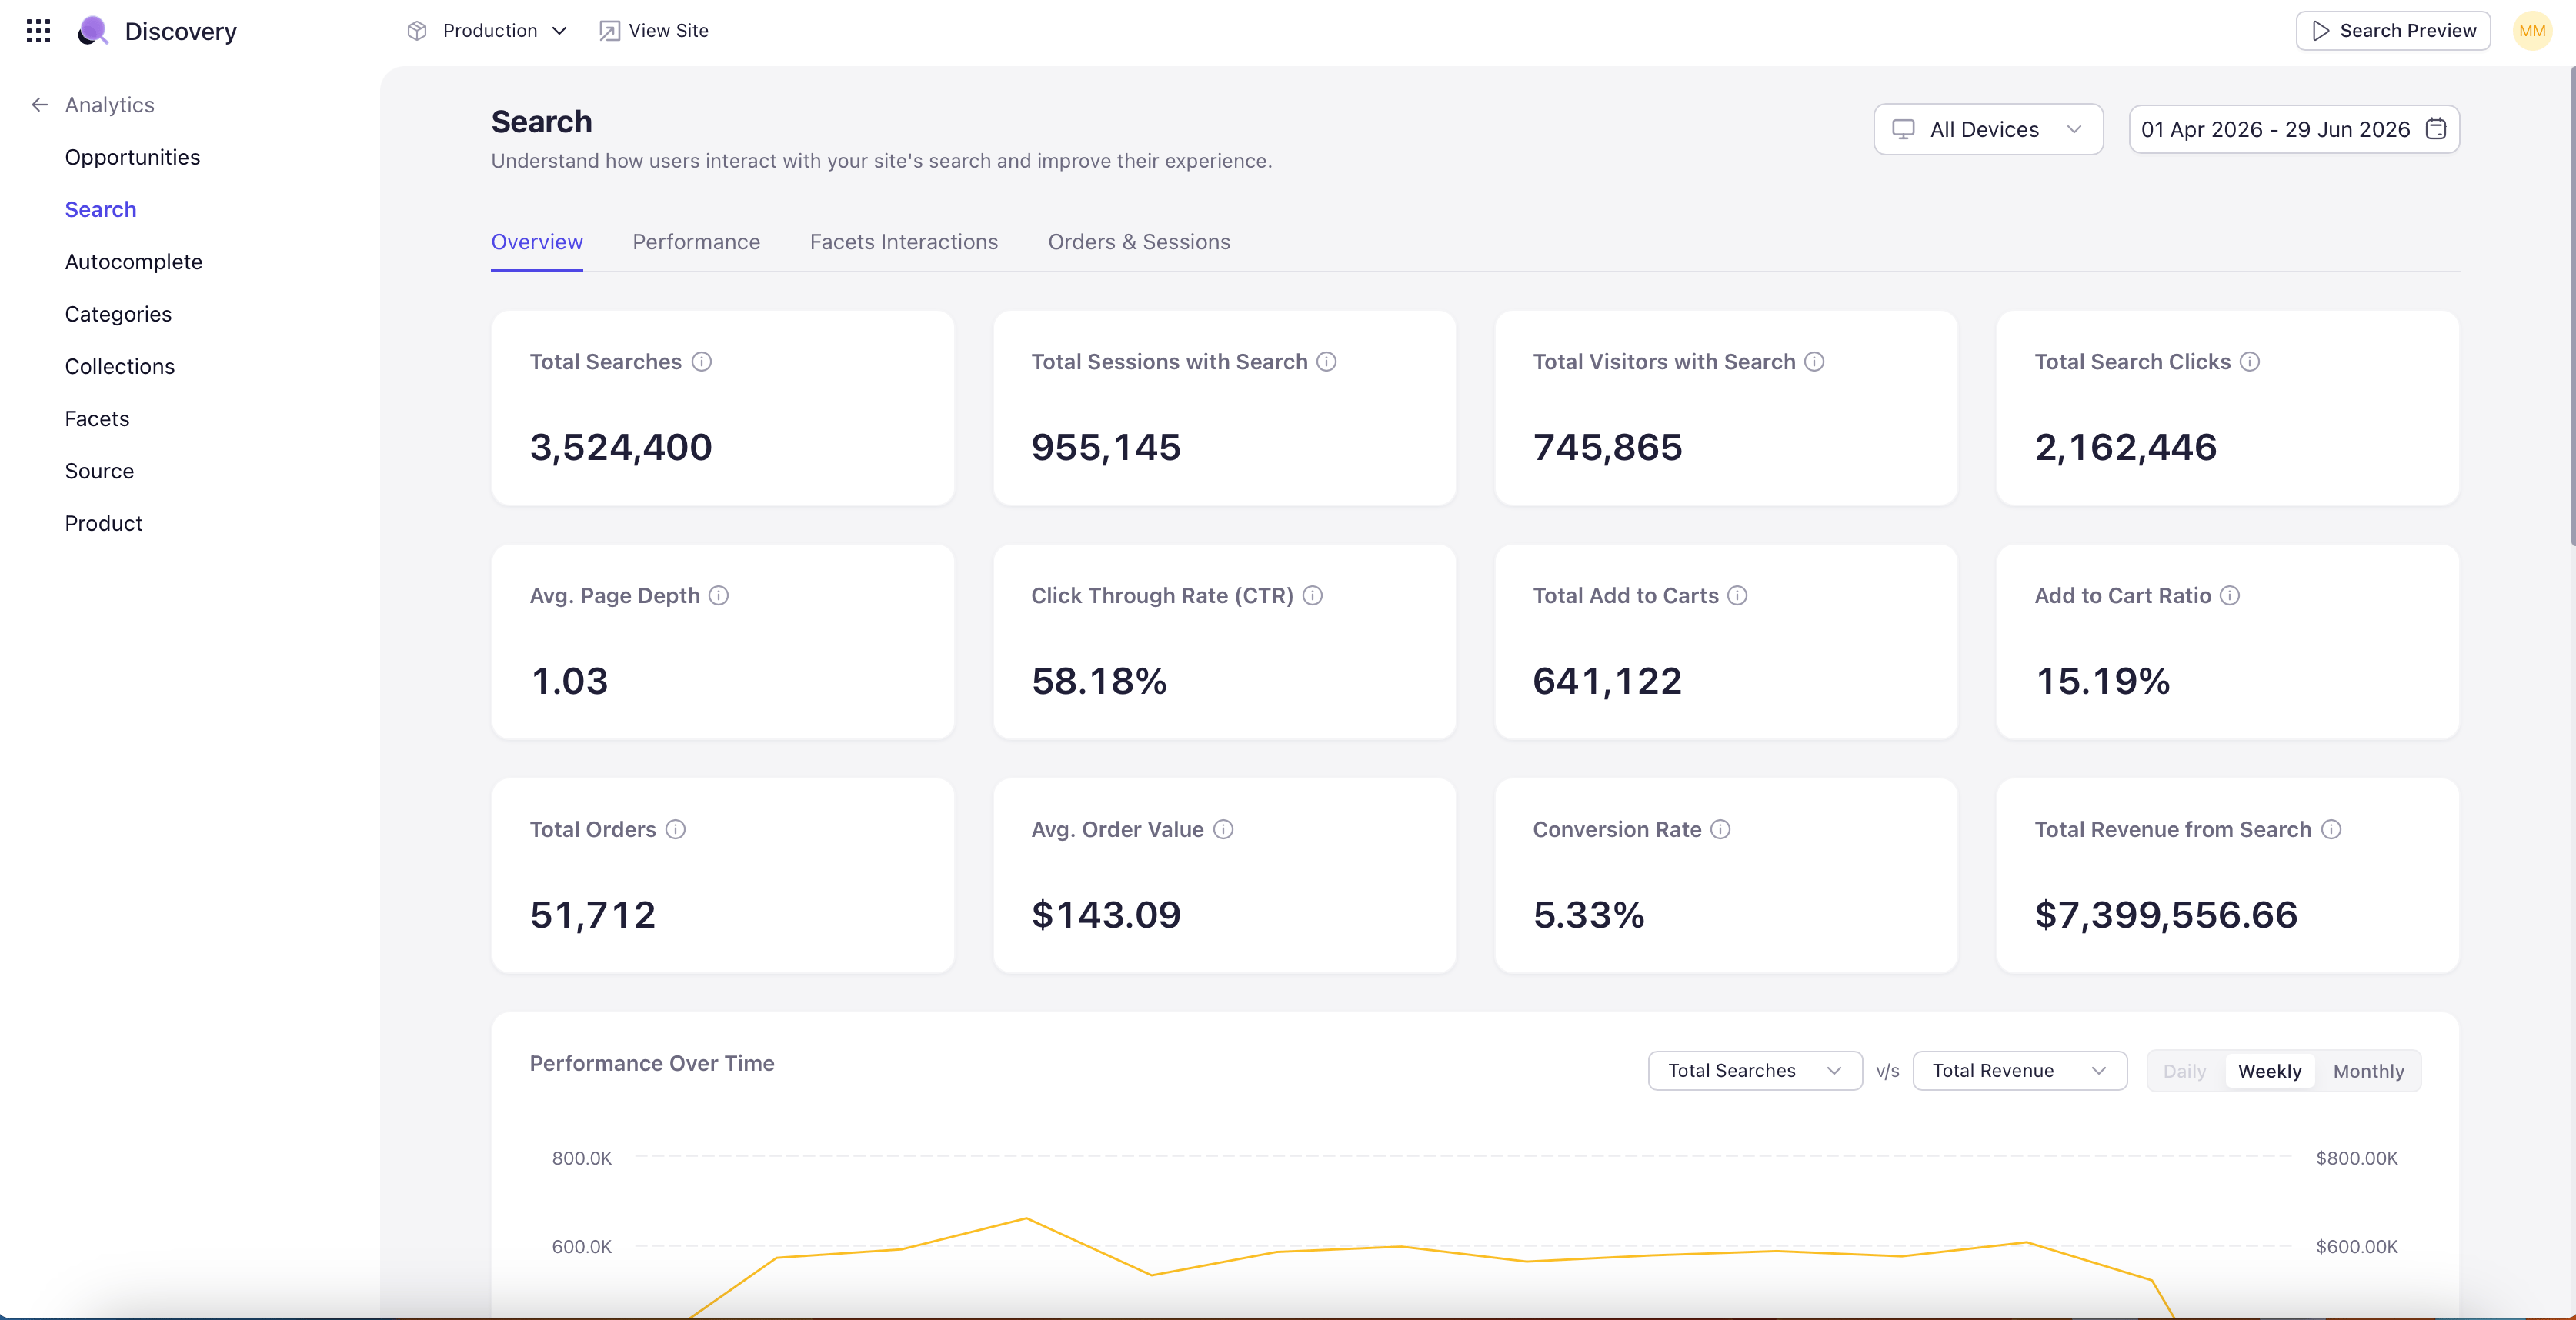
A quick reference of every dashboard in the module and what it is best used for:- Overview — The composite top-line view. Headline KPIs (visits, searches, orders, revenue, conversion rate) with a performance trend chart. The right starting point for any analytics session.
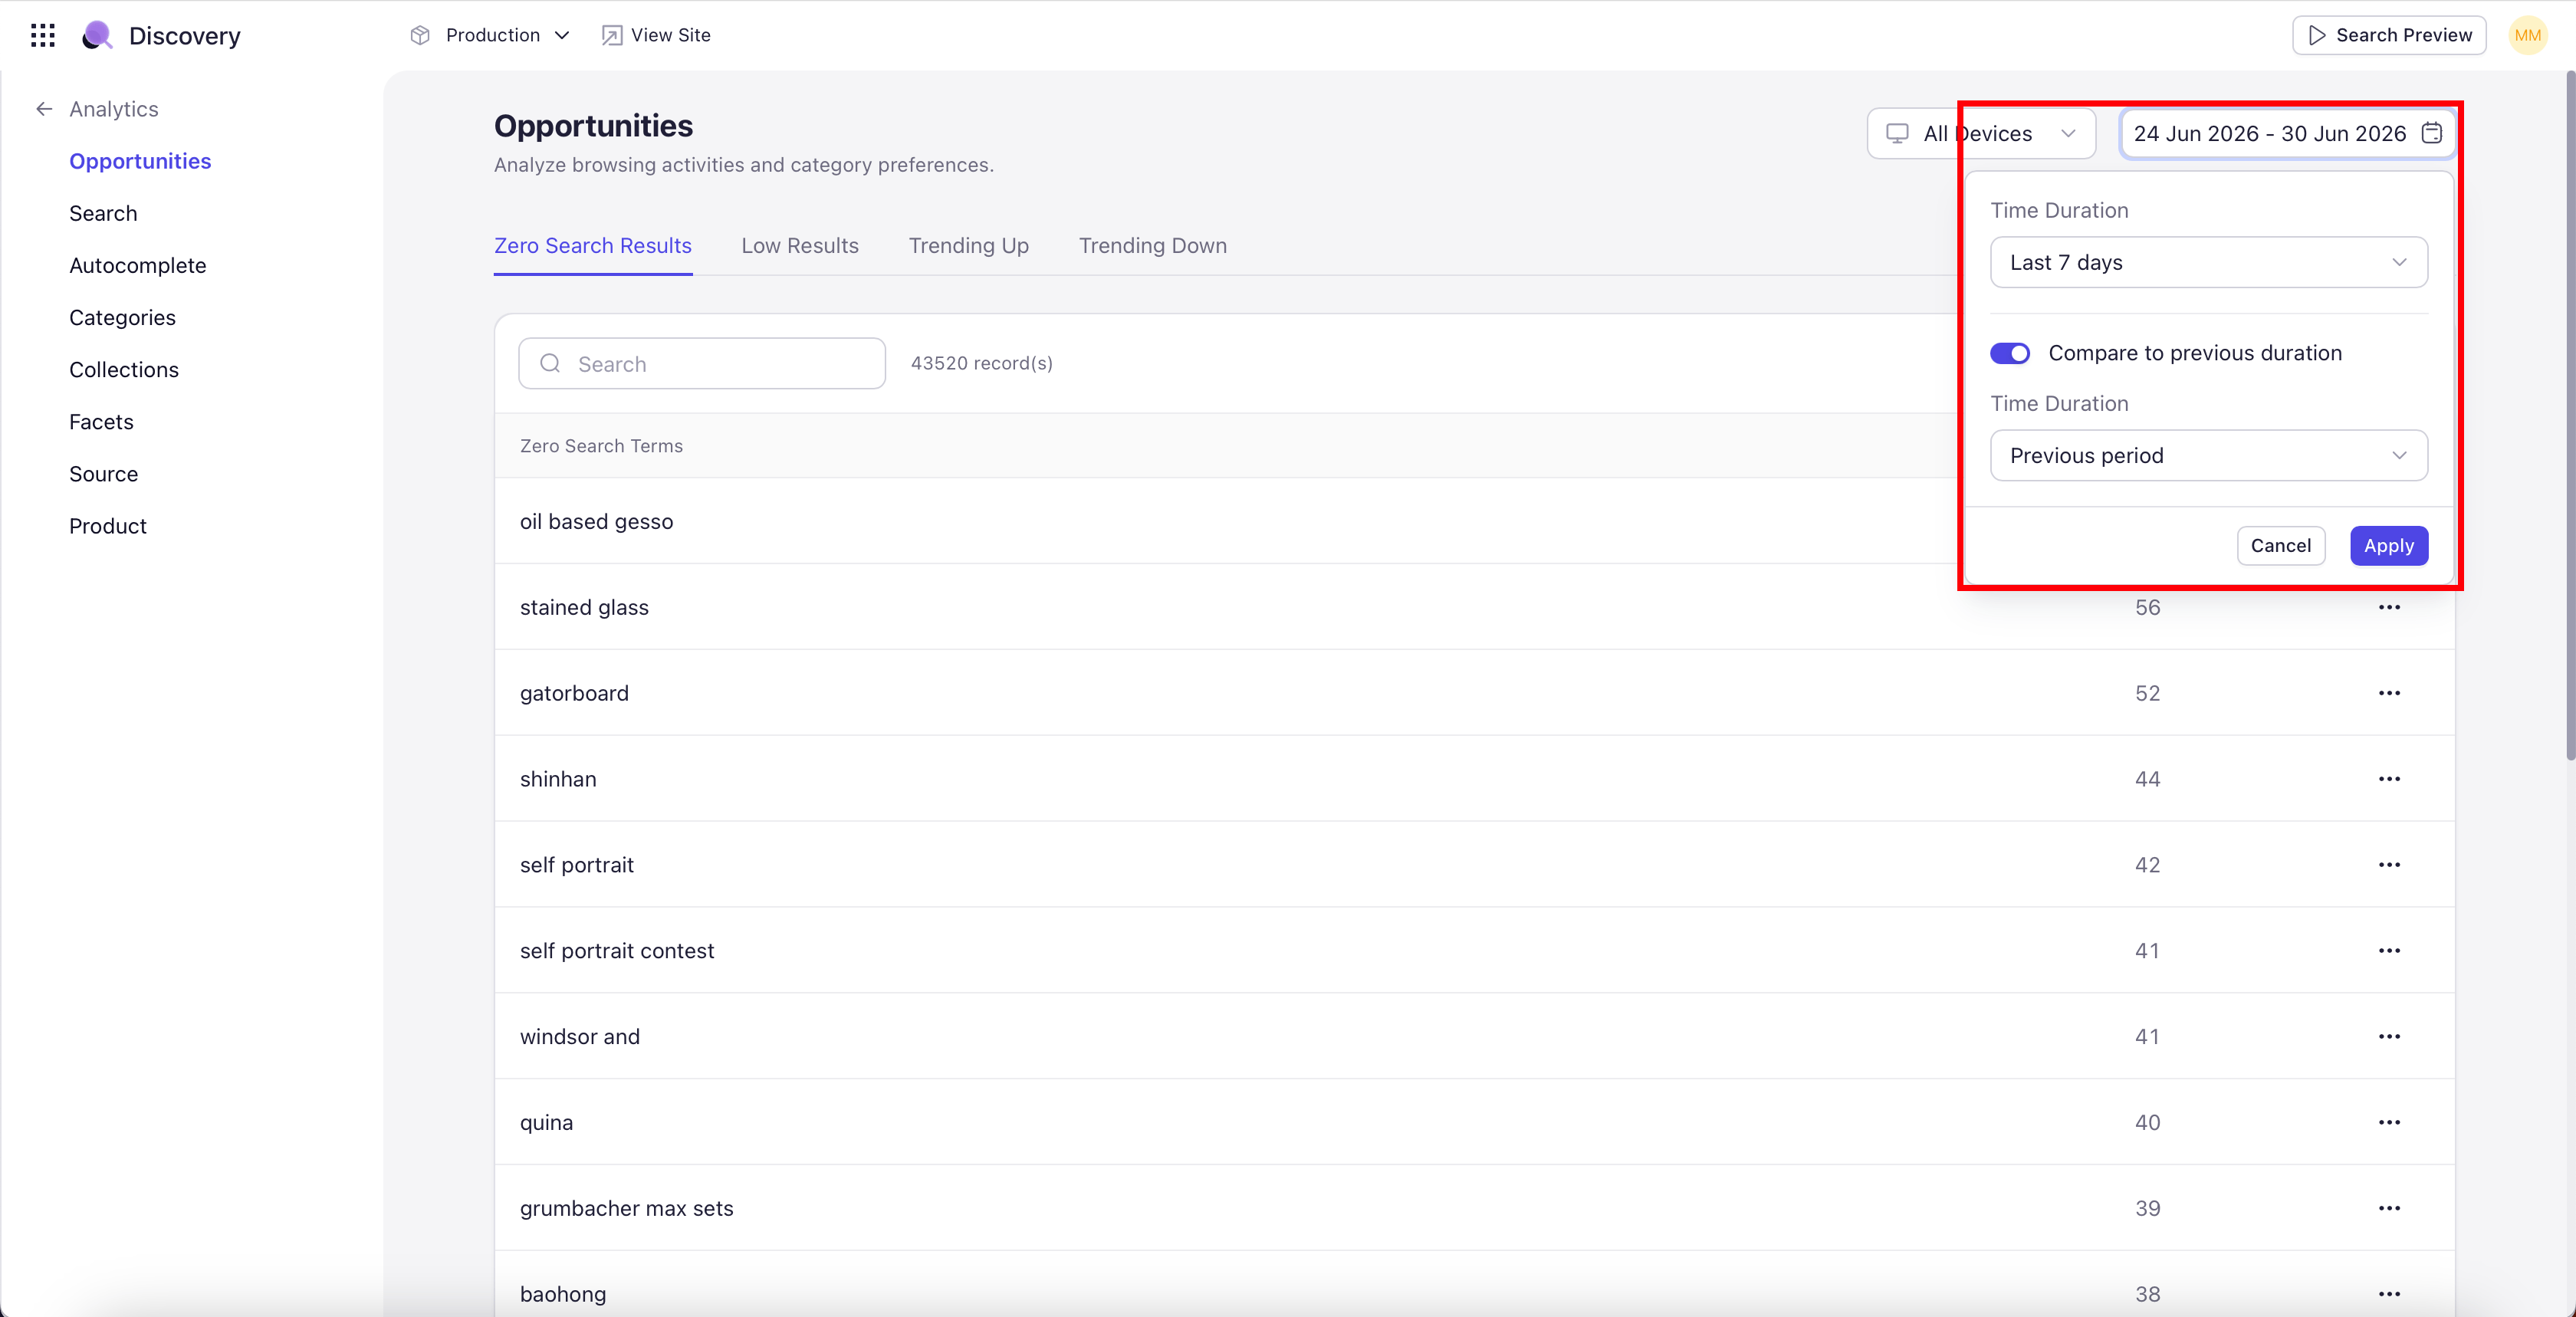
- Opportunities — Surfaces actionable insights — zero-result searches, low-result searches, and search terms trending up or down — so you can intervene before they become problems.
- Search — Search-specific analytics, including the search conversion funnel and the queries that drive (or fail to drive) revenue.
- Autocomplete — Tracks the autocomplete dropdown — suggestion types, top selected suggestions, and how autocomplete interactions evolve over time.
- Categories — Category-page performance — views, clicks, add-to-cart rates, orders, revenue, conversion funnel, and device breakdown.
- Collections — Collection-page performance, separate from Categories because curated collections behave differently from catalog categories.
- Facets — Facet usage — how often shoppers filter, which facets and facet values are most popular, and how facet usage correlates with conversion.
- Products — Product-level performance — best and worst performers, with a per-product drilldown showing full performance history.
- Source — Traffic-source analytics — top referrals, top geographies (with country and region drilldown), and top UTM campaigns with revenue attribution.
Global Controls
Every dashboard shares the same set of controls in the top-right of the page. Setting these once scopes every chart, KPI, and table on the dashboard to the same window.Site selector
Pick the site or storefront variation you want to analyze — for example, French Site, US Site, UK Site. Switching sites scopes every metric on the page to that site only.Device filter
Filter analytics by device type. Options are All Devices (default), Desktop, Mobile, and Tablet. Useful for diagnosing device-specific issues — for example, why mobile conversion is lower than desktop, or why facets are used less often on mobile.Date range
Select the time period for the dashboard. The date range picker offers ten preset durations and a custom range:- Today
- Yesterday
- Last 7 days
- Last 14 days
- Last 30 days
- Last 60 days
- Last 90 days
- Last 6 months
- Last 12 months
- Custom date range (pick any start and end date from the calendar picker).
Compare
Compare gives you a benchmark. Every KPI on the dashboard shows a percentage change against the chosen comparison period, with a green up arrow for positive change and a red down arrow for negative. Switch on Compare and pick one of four modes:- Previous duration — The same number of days immediately before the selected range. Last 7 days compared against the 7 days before that.
- Previous period — The same calendar period in the prior cycle. The current month-to-date compared against the previous full month.
- Same period last year — The same dates one year ago. Essential for seasonal benchmarks where last week’s number tells you nothing about whether you’re on track.
- Custom date range — Any custom start and end date. Useful for comparing against a specific campaign window or a known baseline.
Search Preview
The Search Preview button opens the Search Preview tool with the current site, device, and date range pre-selected, so you can validate live search behavior without losing your analytics context.Store Not Connected
When you open Analytics for the first time, or when the catalog connection drops, you may see a Store Not Connected state. This is normal during initial setup and after deliberate disconnections. Reconnect the catalog through Catalog Connection to begin populating analytics.Analytics begins collecting from the moment the catalog is connected — there is no historical backfill. The first few hours after connection will show partial data; expect a full first day before headline KPIs are meaningful.