How to Use Facets
Navigate to the Analytics section and select Facets from the left navigation. Set the site, device, date range, and comparison period from the controls in the upper right. Facet usage is one of the strongest predictors of conversion intent. Shoppers who apply filters are signaling specific intent — understanding facet behavior is therefore a direct lever on revenue.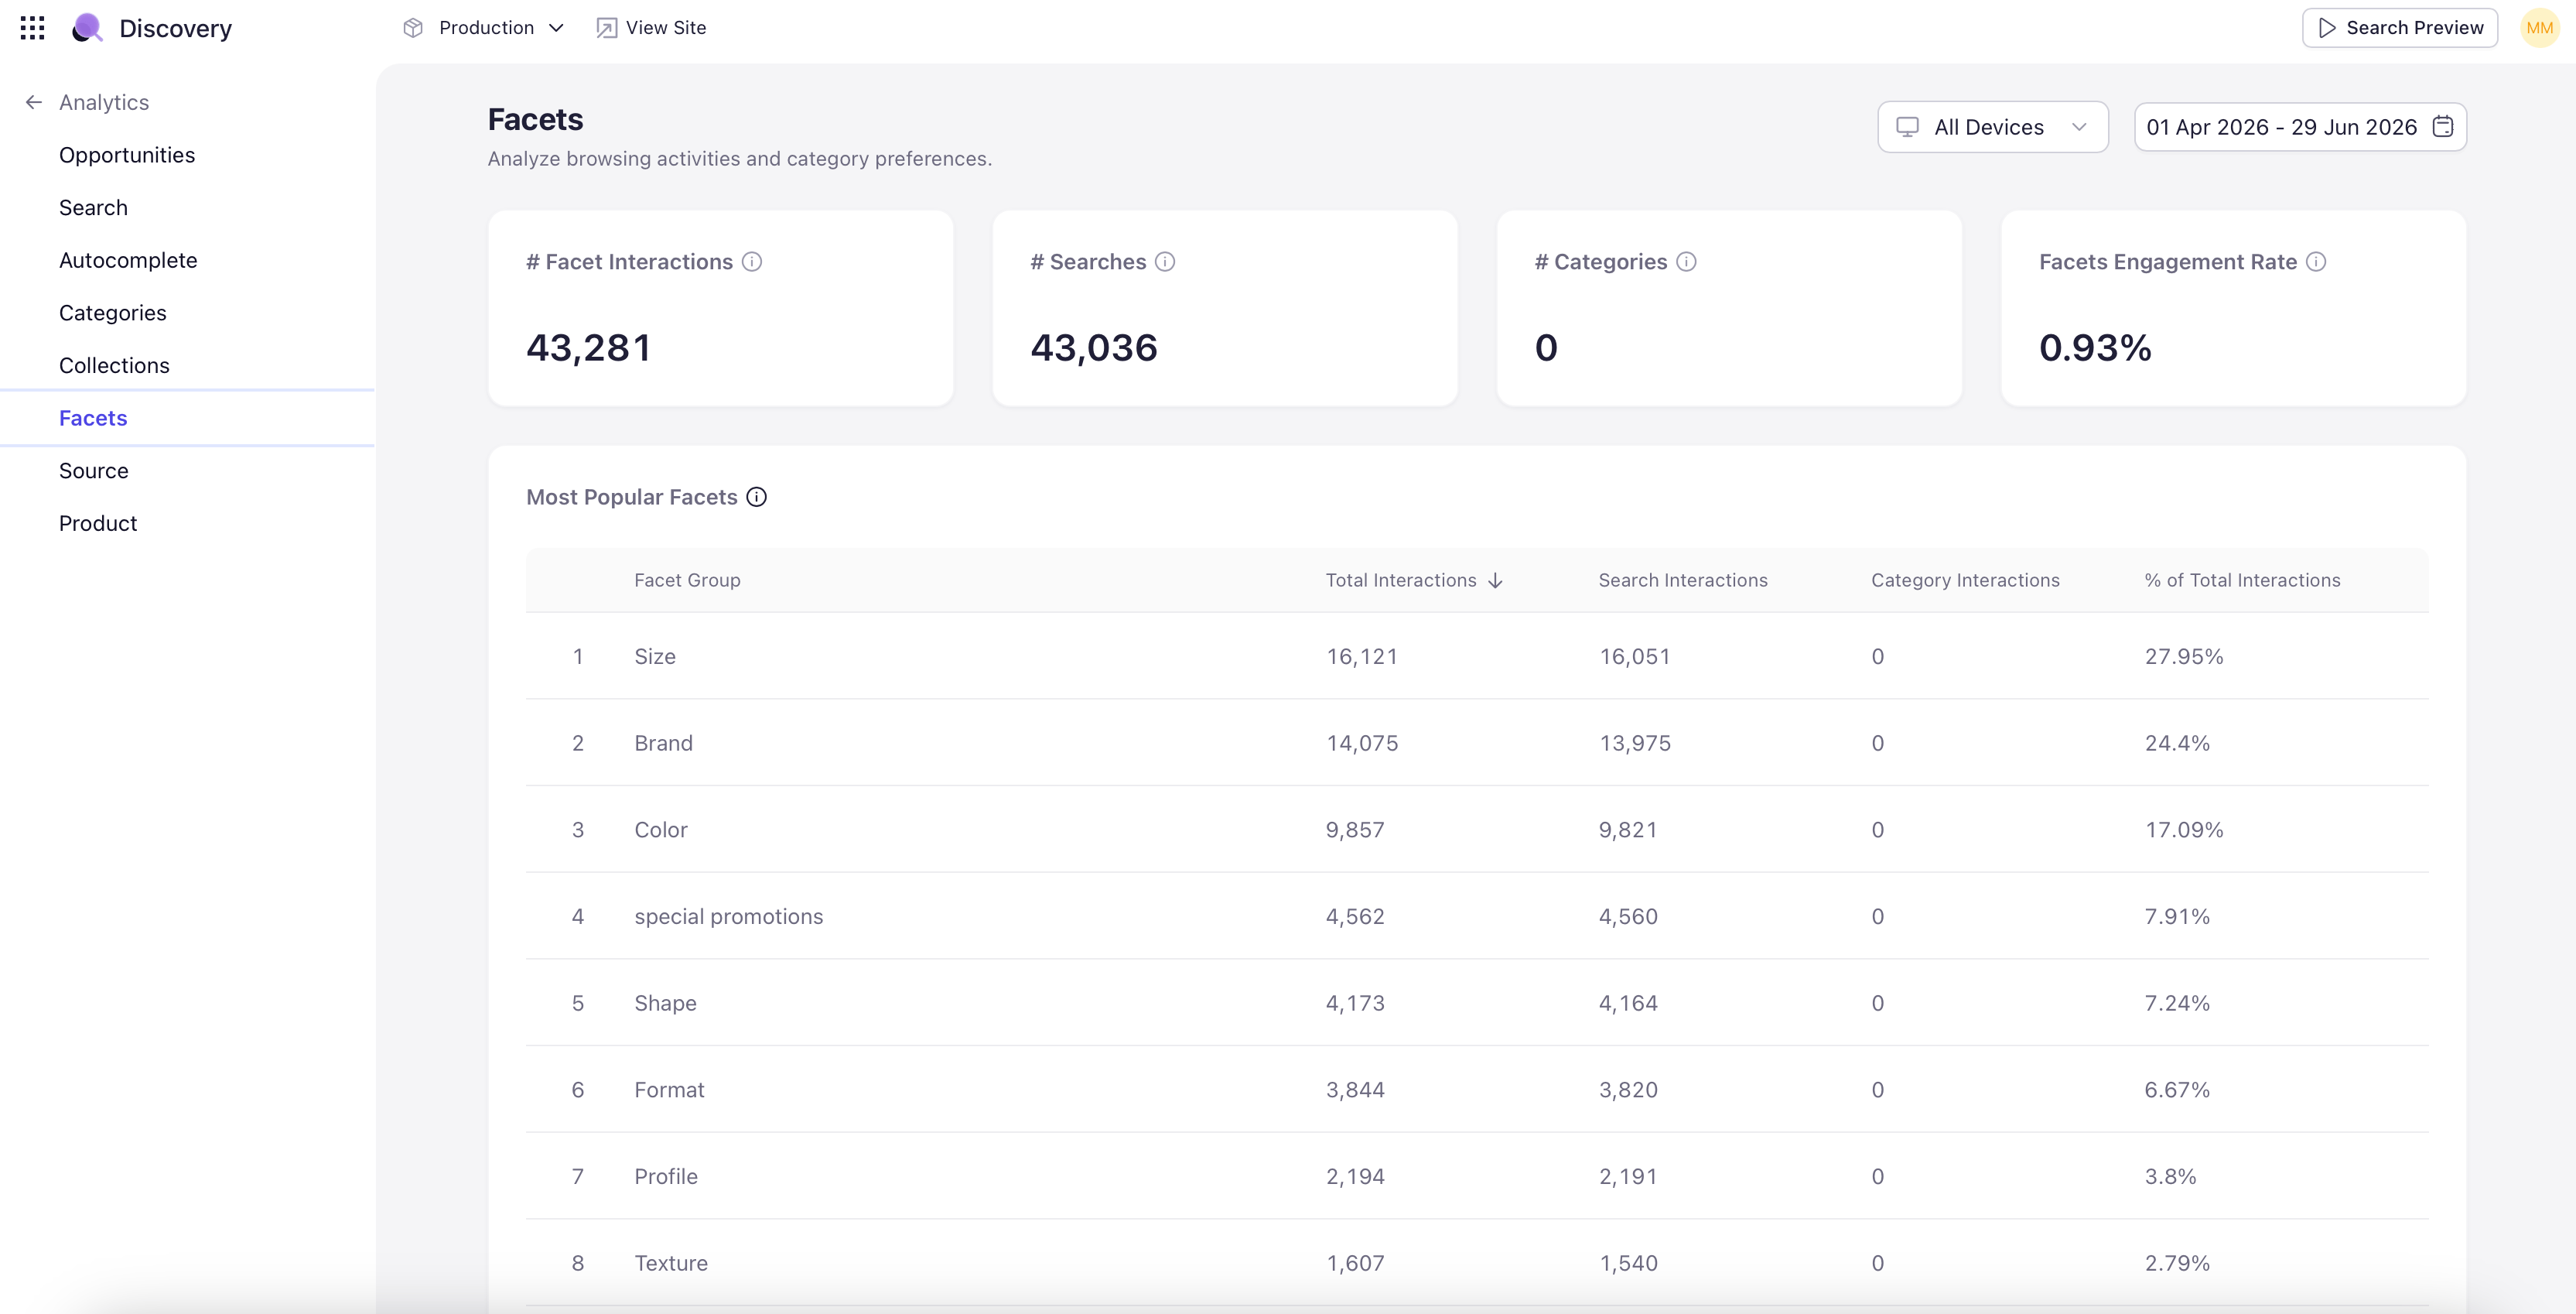
Facet KPIs
Four KPI tiles open the dashboard:- # Facet Interactions — Total number of facet selections across all sessions during the period.
- # Searches with Facets — Number of search sessions in which the shopper applied at least one facet.
- # Categories with Facets — Number of category-page sessions with at least one facet applied.
- Facets Engagement Rate — Percentage of qualifying sessions that included facet usage. A high-level health metric for the filter experience.
Most Popular Facets
A ranked table of facet groups (Category, Product Type, Colour, Material, Price, Size Range, Capacity, Dimensions, Brand, Availability) showing Total Interactions, Search Interactions, Category Interactions, and % of Total Interactions. Tells you which facets matter most overall and how their usage splits between search-results pages and category pages.Most Popular Facet Values
A ranked table of specific facet values — Dress, Trousers, Black, Silk, Cotton, White, Red, Blue, Shirt, Wooden — with the facet group each belongs to and total interactions. Useful for inventory planning and merchandising prioritization.Facets Performance
Two sub-tabs that link facet usage back to traffic sources:- Top Searches with Facet Usage — Search terms that most often led to facet interactions. Queries where the result set was broad enough that shoppers needed filters to narrow — a useful diagnostic for relevance tuning.
- Top Categories with Facet Usage — Category pages where shoppers most often applied facets. Tells you which categories need the strongest facet design.