How to Use Collections
Navigate to the Analytics section and select Collections from the left navigation. Set the site, device, date range, and comparison period from the controls in the upper right. Collections are tracked separately from Categories because they typically perform very differently — a well-curated collection often outperforms the equivalent category on both engagement and conversion. The Collections dashboard answers whether your curation is paying off. The dashboard is organized into four tabs across the top: Overview, Performance, Facets Interactions, and Orders & Sessions. Open the tab that matches the question you are answering.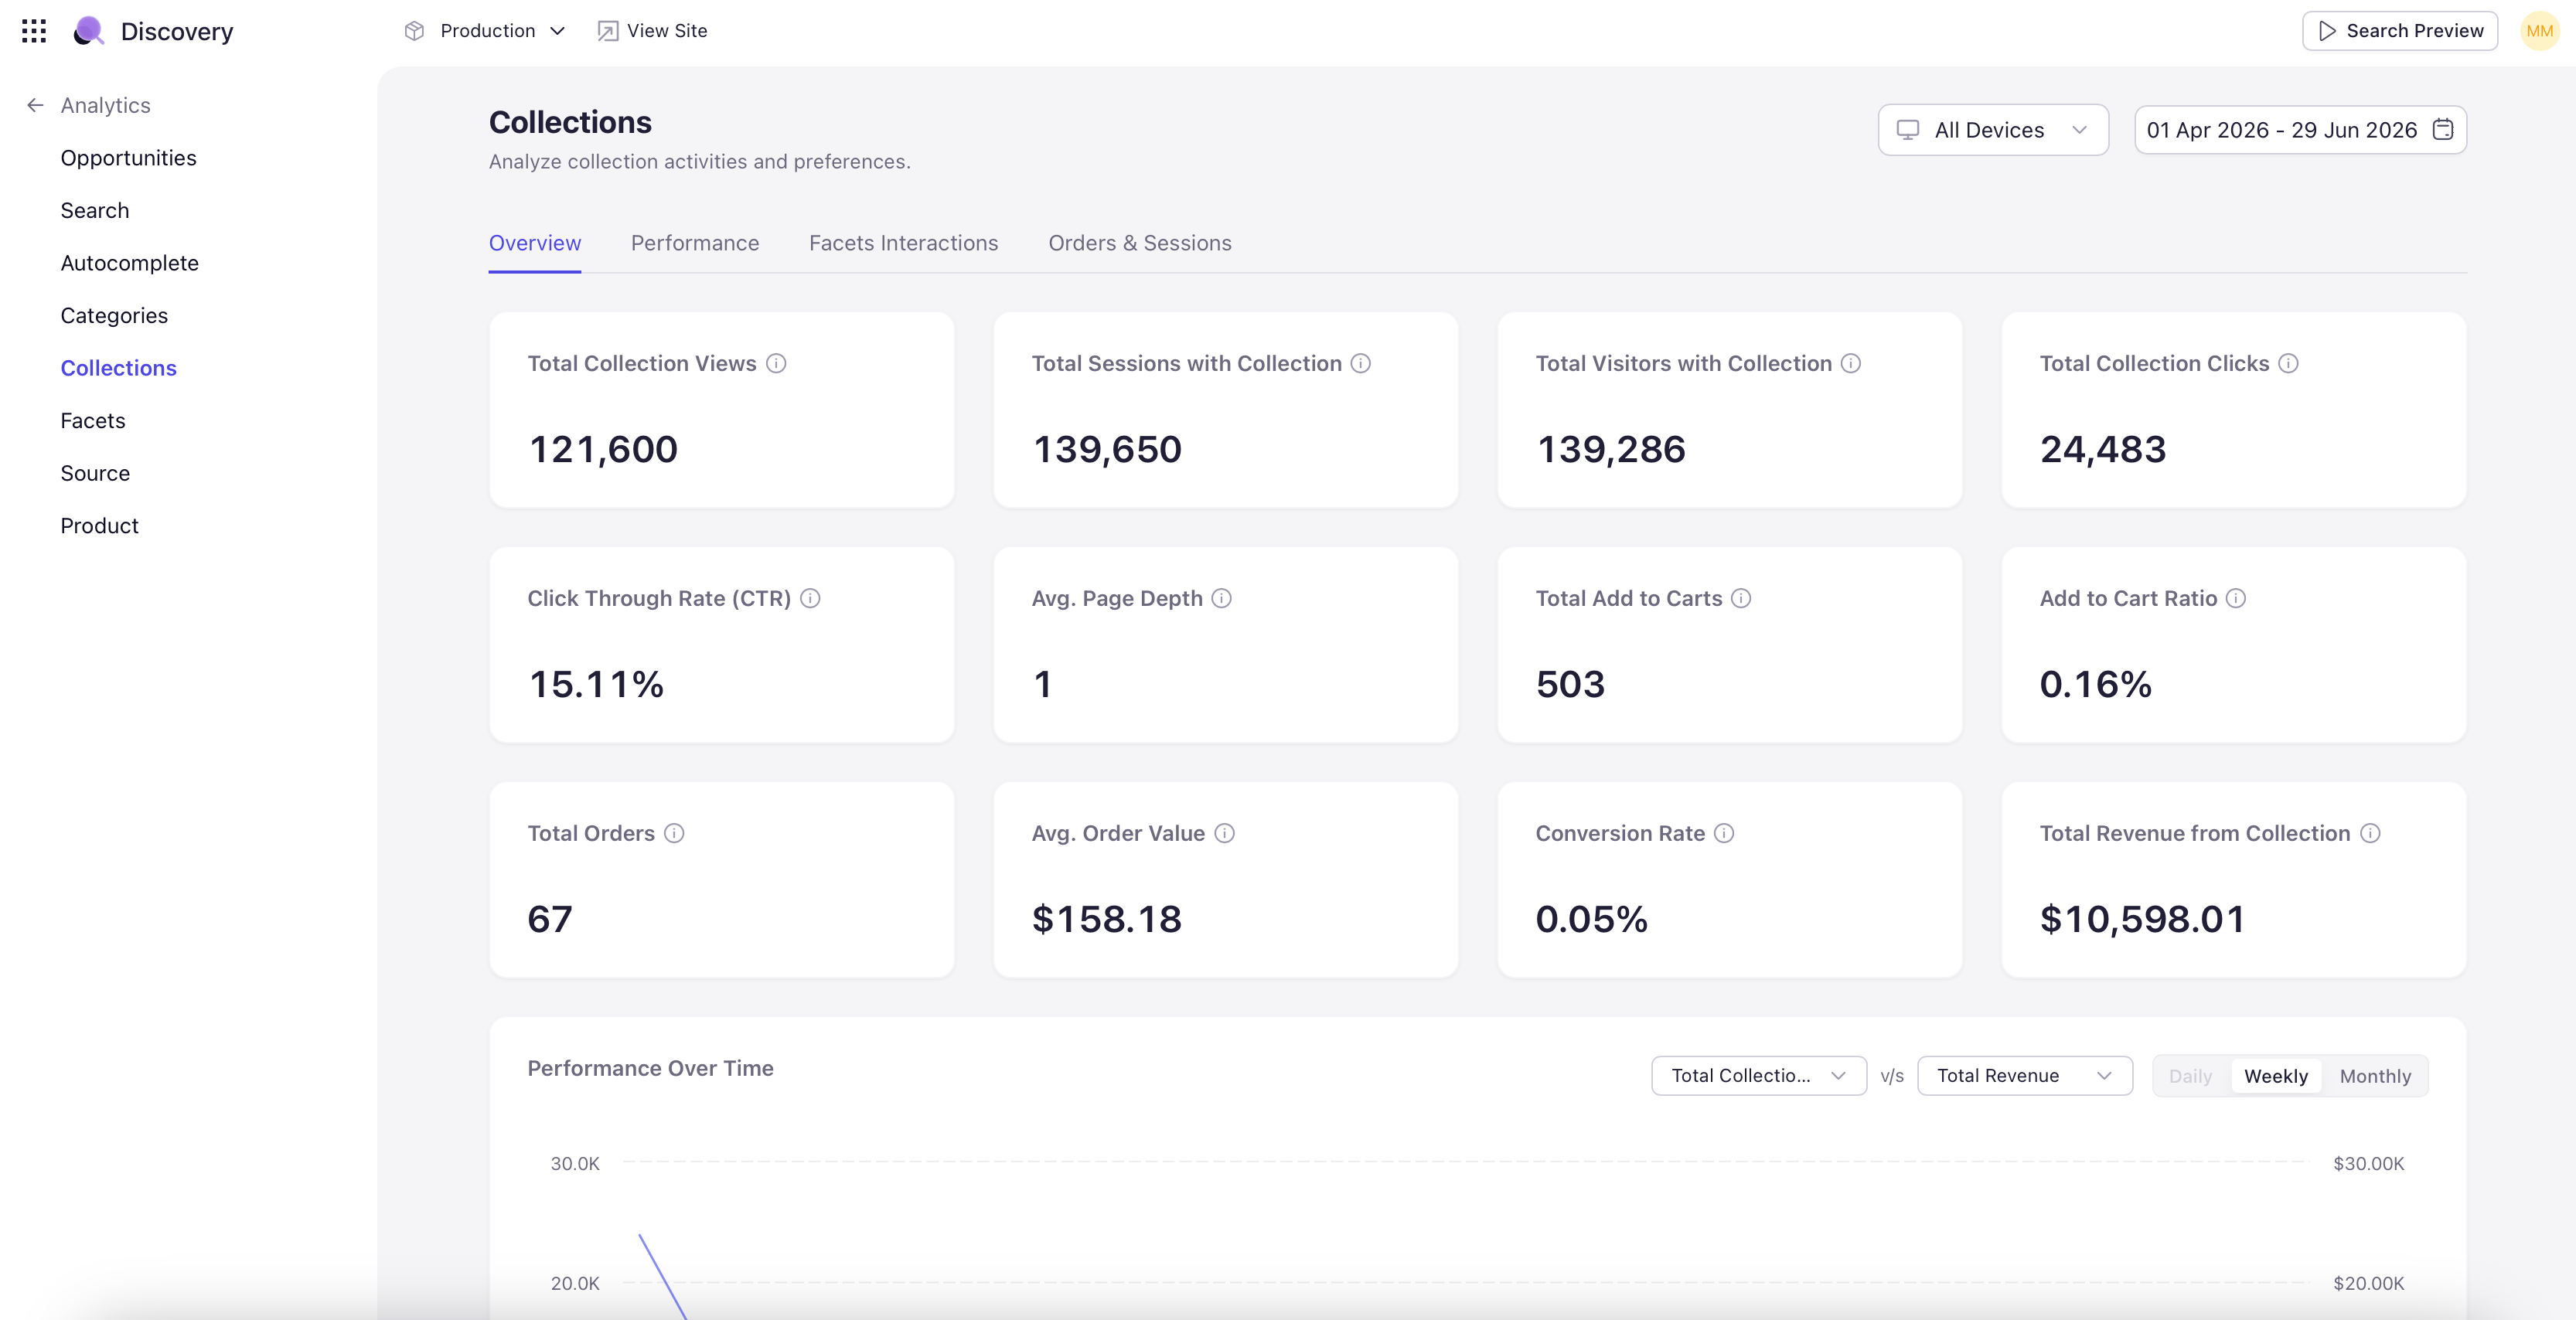
Overview Tab
Headline KPIs and trend charts. Three rows of KPI tiles cover the full collection funnel:- Engagement — Total Collection Views, Total Sessions with Collection, Total Visitors with Collection, Total Collection Clicks.
- Conversion — Click-Through Rate (CTR), Average Page Depth, Total Add to Carts, Add-to-Cart Rate.
- Revenue — Total Orders, Average Order Value, Conversion Rate, Total Revenue from Collection.
Performance Tab
Per-collection performance breakdown. The main table shows each collection with views, clicks, CTR, add-to-cart rate, orders, and revenue. Sort by any column. Switch between the Top Collection and Top Products sub-tabs to see either the collection-level view or the products within those collections. Below the main table, an Optimizing Opportunities section surfaces collections that need attention. Three sub-tabs cover the three patterns to watch for:- Lowest Converting Collection — Collections at the bottom of the conversion ranking.
- Collection with Missing Products — Collections referencing products that no longer exist in the catalog.
- Top Collection with High Exit Rate — High-volume collections where shoppers are leaving rather than continuing into a product page.
Facets Interactions Tab
Facet usage scoped to collection pages. Three widgets surface the key signals:- Popular Facets on Collection Page — Ranked list of facet groups used on collection pages — for example, Category, Product Type, Colour, Material, Price.
- Collection Facet Interactions — A donut chart splitting collection sessions into Facet Interactions vs Non-Facet Interactions. Use to gauge whether shoppers on collection pages need filters or browse without them.
- Most Popular Facet Values — Specific facet values most often selected on collection pages — Dress, Trousers, Black, Silk, Cotton, and so on.