

Web Page
Summary tiles cover Total Visitors, New Visitors, Returning Visitors, Average Time on Page, Total Page Views, Unique Page Views, Exit Rate, and Bounce Rate.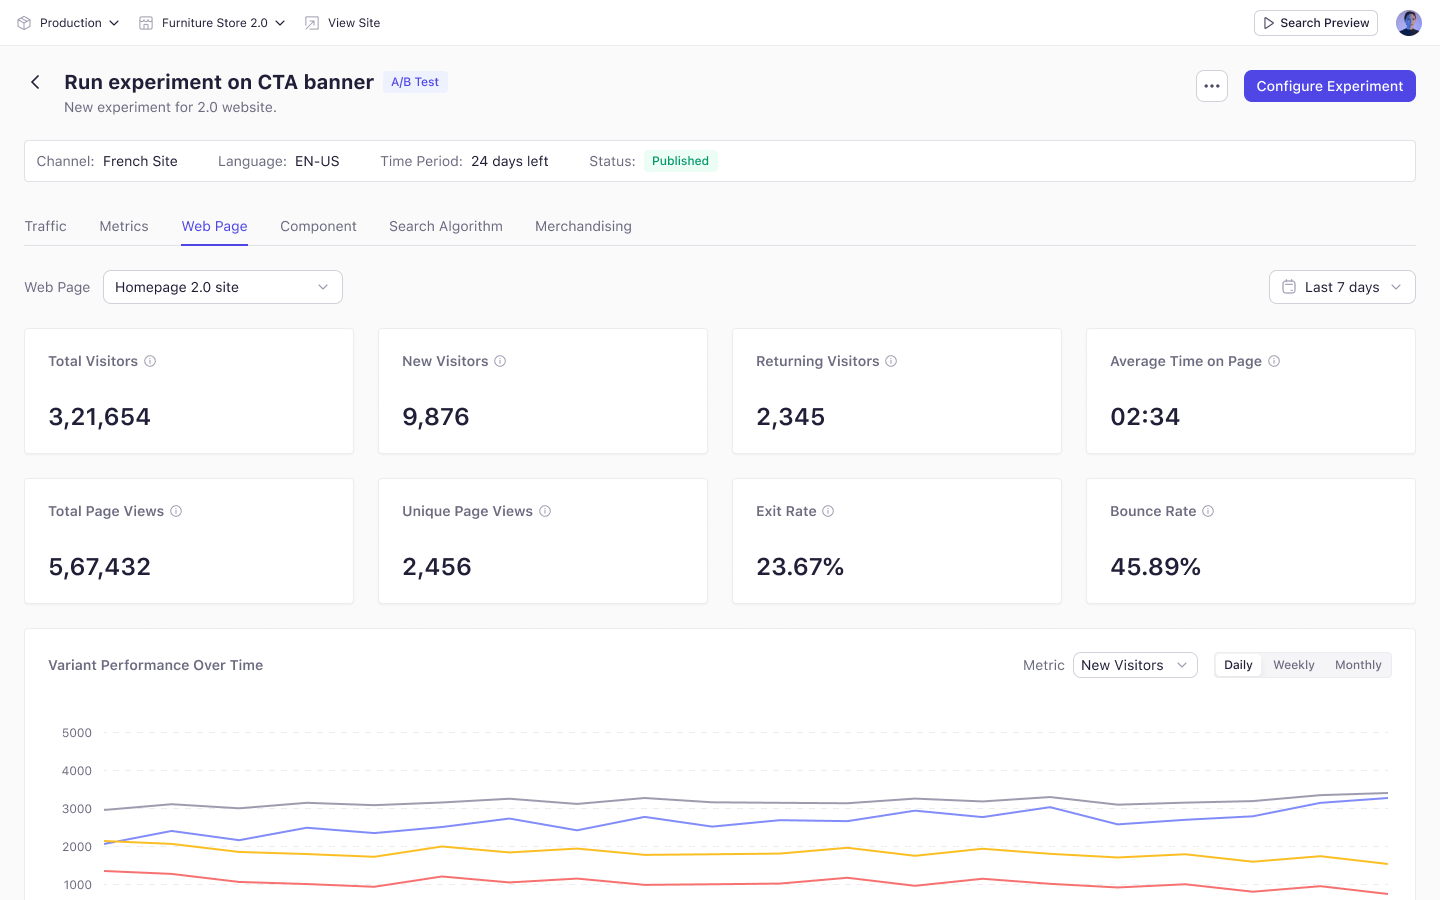
- Variant Performance Over Time — a chart for any tile metric, at daily, weekly, or monthly granularity.
- Metrics by Variant — every tile metric broken out by group.
- Visitor by Device, Traffic by Location, and Traffic by Browser — distributions per group.
Component
Summary tiles cover Component Impressions, Component Clicks, and Interaction Rate, where interaction rate is clicks divided by impressions. The tab also breaks these out by variant, device, location, and browser.Search Algorithm
Summary tiles cover Search Views, Search Clicks, CTR, Add to Cart Rate, Total Orders, Avg. Order Value, and Total Search Revenue. Below them sit a variant performance chart, a metrics-by-variant table, and a traffic-by-device table.Merchandising
Summary tiles cover Product Impressions, Product Clicks, Add to Cart Rate, Conversion Rate, Merchandising Revenue, Avg. Order Value, and Rule Hit Count. Below them sit a variant performance chart and a metrics-by-variant table.Key Considerations
- Tabs appear only for experience types included in the experiment.
- The duration selector at the top applies across every tab.
- Personalization experiments use the same layout without control group columns.
Experience tabs describe how a specific page or rule performed. Use them to explain a result, not to decide the winner — that decision belongs to the primary metric on the Metrics tab.