

The Summary Bar
Time Period shows
∞ days when no end date is set, and is hidden while the experiment is a draft.
Ending an experiment early freezes both readings. An experiment ended with two days left permanently shows “2 days left” — a record of how early you stopped it.
Traffic Tab
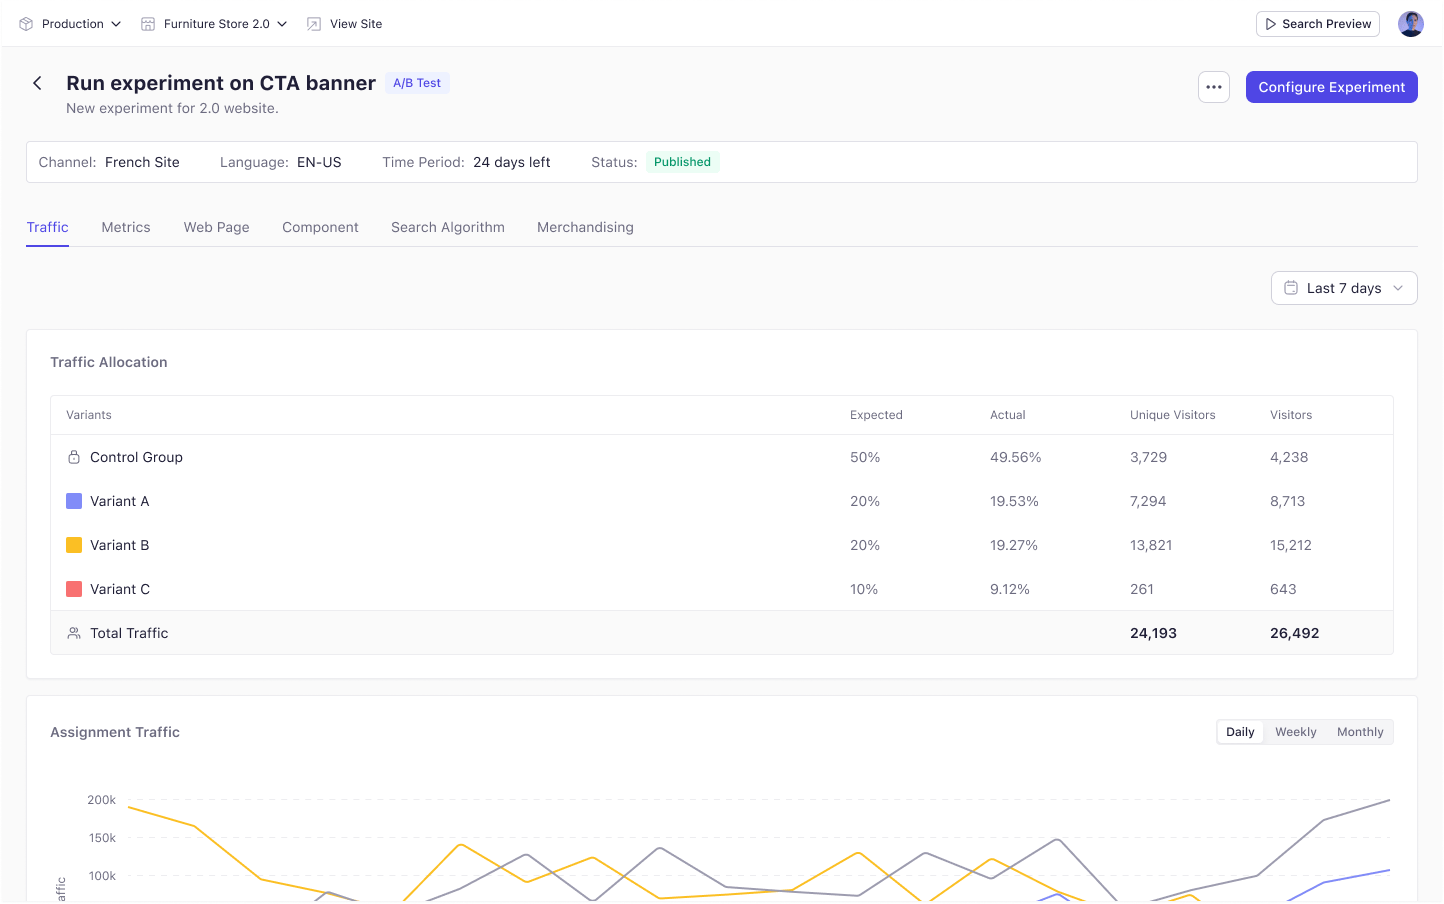
Traffic Allocation compares the split you configured against what actually happened.
Small gaps between expected and actual are normal. Large or persistent gaps are worth investigating before you trust the results.
Below it, Assigned Traffic plots each group’s share over time.
Metrics Tab
Metrics are split into Primary Metrics and Secondary Metrics, each showing one row per group.
The control group is marked with a lock icon and reads
Baseline in every improvement column. Each variant is measured against it.
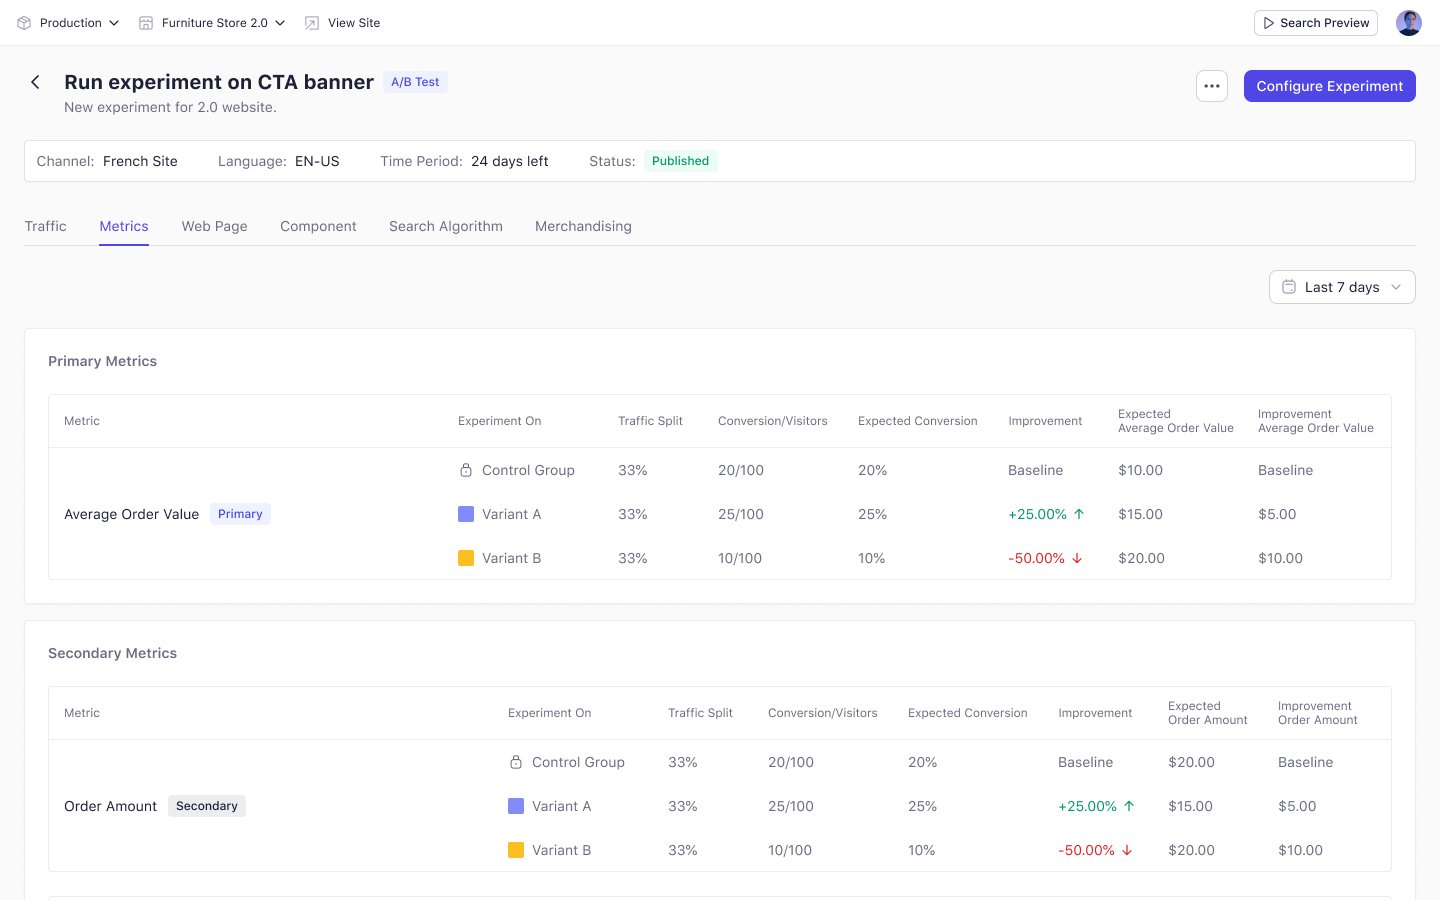
((VariantMetric - ControlMetric) / ControlMetric) * 100.
Below the tables, Metrics Over Time plots a selected metric for every group.
Judge the winner on the primary metric. Secondary metrics tell you whether the win came at a cost elsewhere.