Result Ranking Strategy
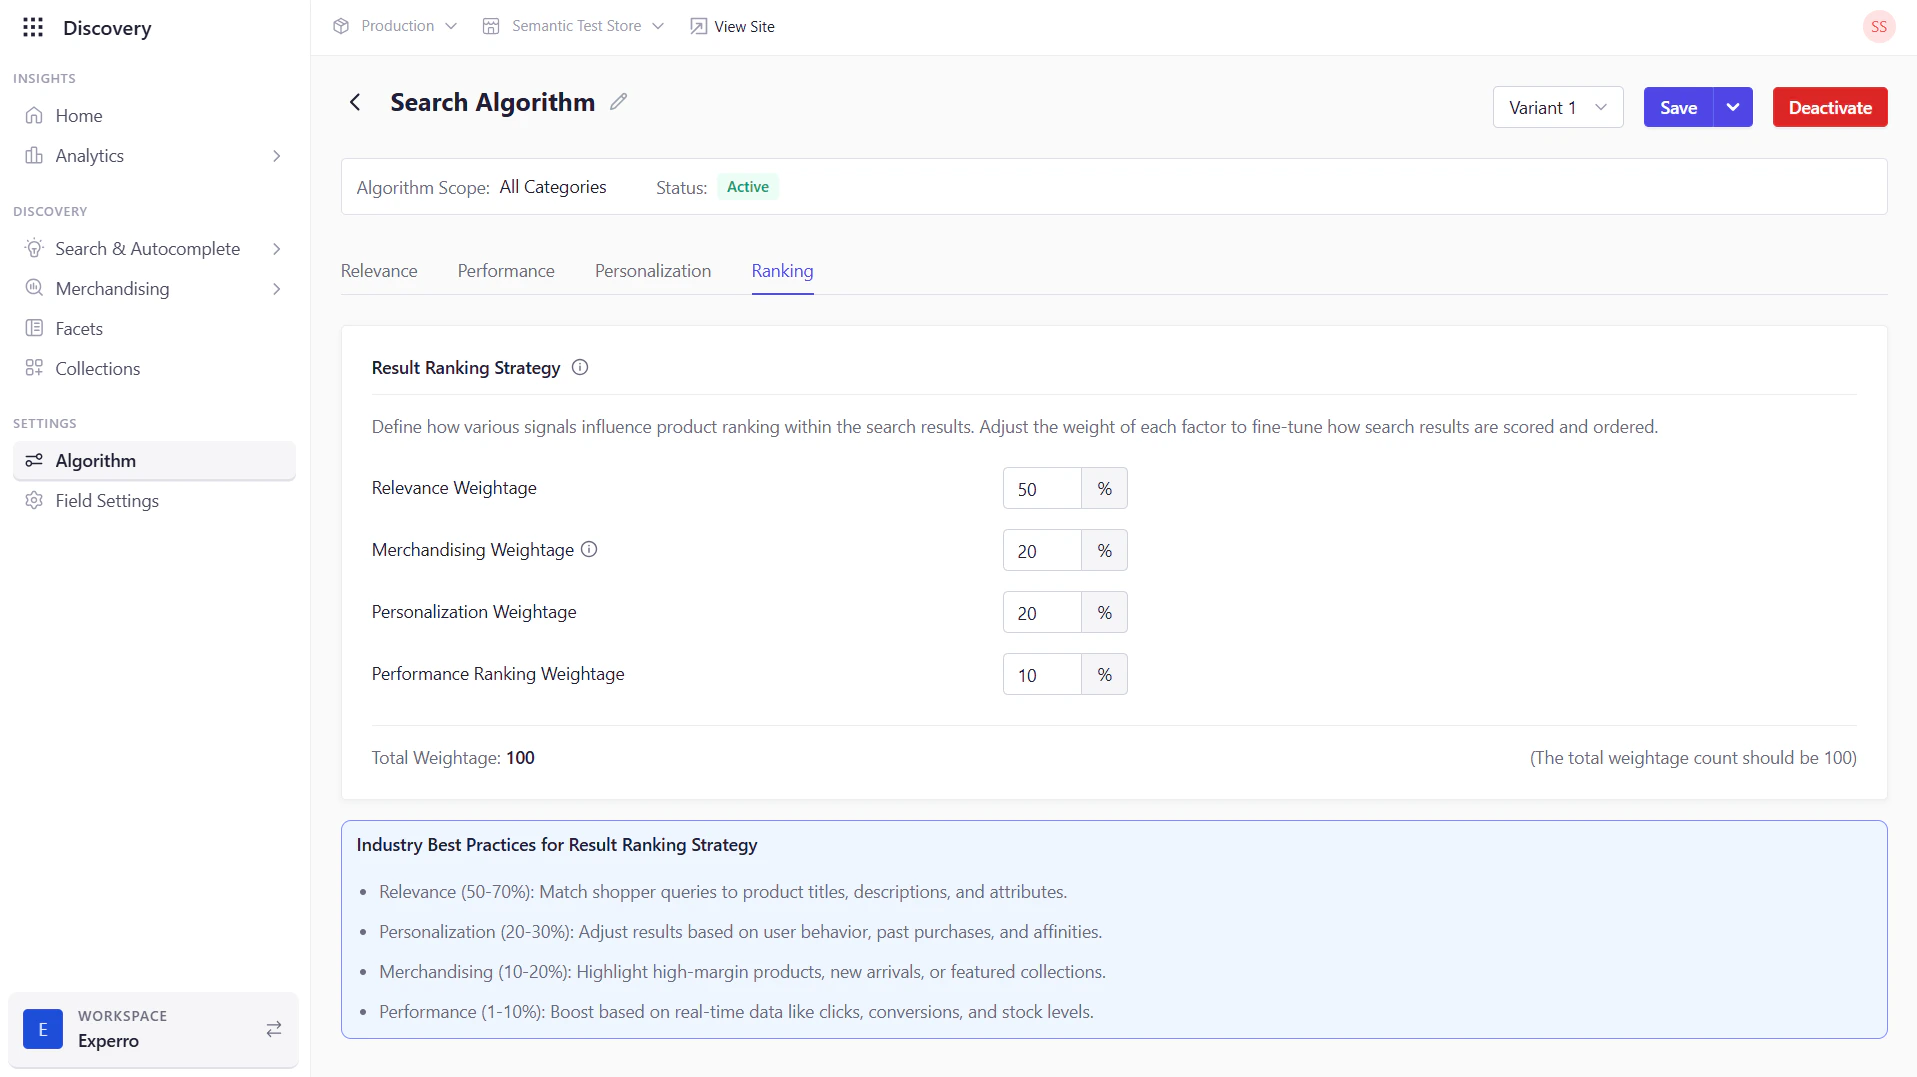
At the top of this tab, you’ll see four sliders—one for each signal. They always sum to 100, representing the total “score budget” allocated across:| Control | Description |
|---|---|
| Relevance Weightage (%) | Percentage devoted to matching shopper queries against product titles, descriptions, and attributes. |
| Merchandising Weightage (%) | Percentage for business-driven overrides (e.g., promoting new arrivals, high-margin items, or campaigns). |
| Personalization Weightage (%) | Percentage to boost products based on individual user affinity and past behaviors. |
| Performance Ranking Weightage (%) | Percentage for engagement-based signals (clicks, conversions, stock levels) to influence ranking. |
| Total Weightage (100) | Ensures that the combined weights of all four signals equal 100, preventing unintended bias. |
Industry Best Practices
Below the sliders, you’ll find recommended ranges to help you get started. These serve as a baseline but feel free to adapt based on your unique catalog, audience, and goals:| Signal | Suggested Range | Rationale |
|---|---|---|
| Relevance | 50–70% | Ensures most results closely match user queries, creating a solid foundation for any experience. |
| Personalization | 20–30% | Leverages user data to surface items that resonate individually—boosts engagement and conversion for returning visitors. |
| Merchandising | 10–20% | Allows business priorities (e.g., featured products, promotions, inventory pushes) to shine through without completely overriding relevance. |
| Performance | 1–10% | Adds real-time engagement signals, ensuring that trending or high-converting items gain a slight bump without causing volatility. |