Core Metrics

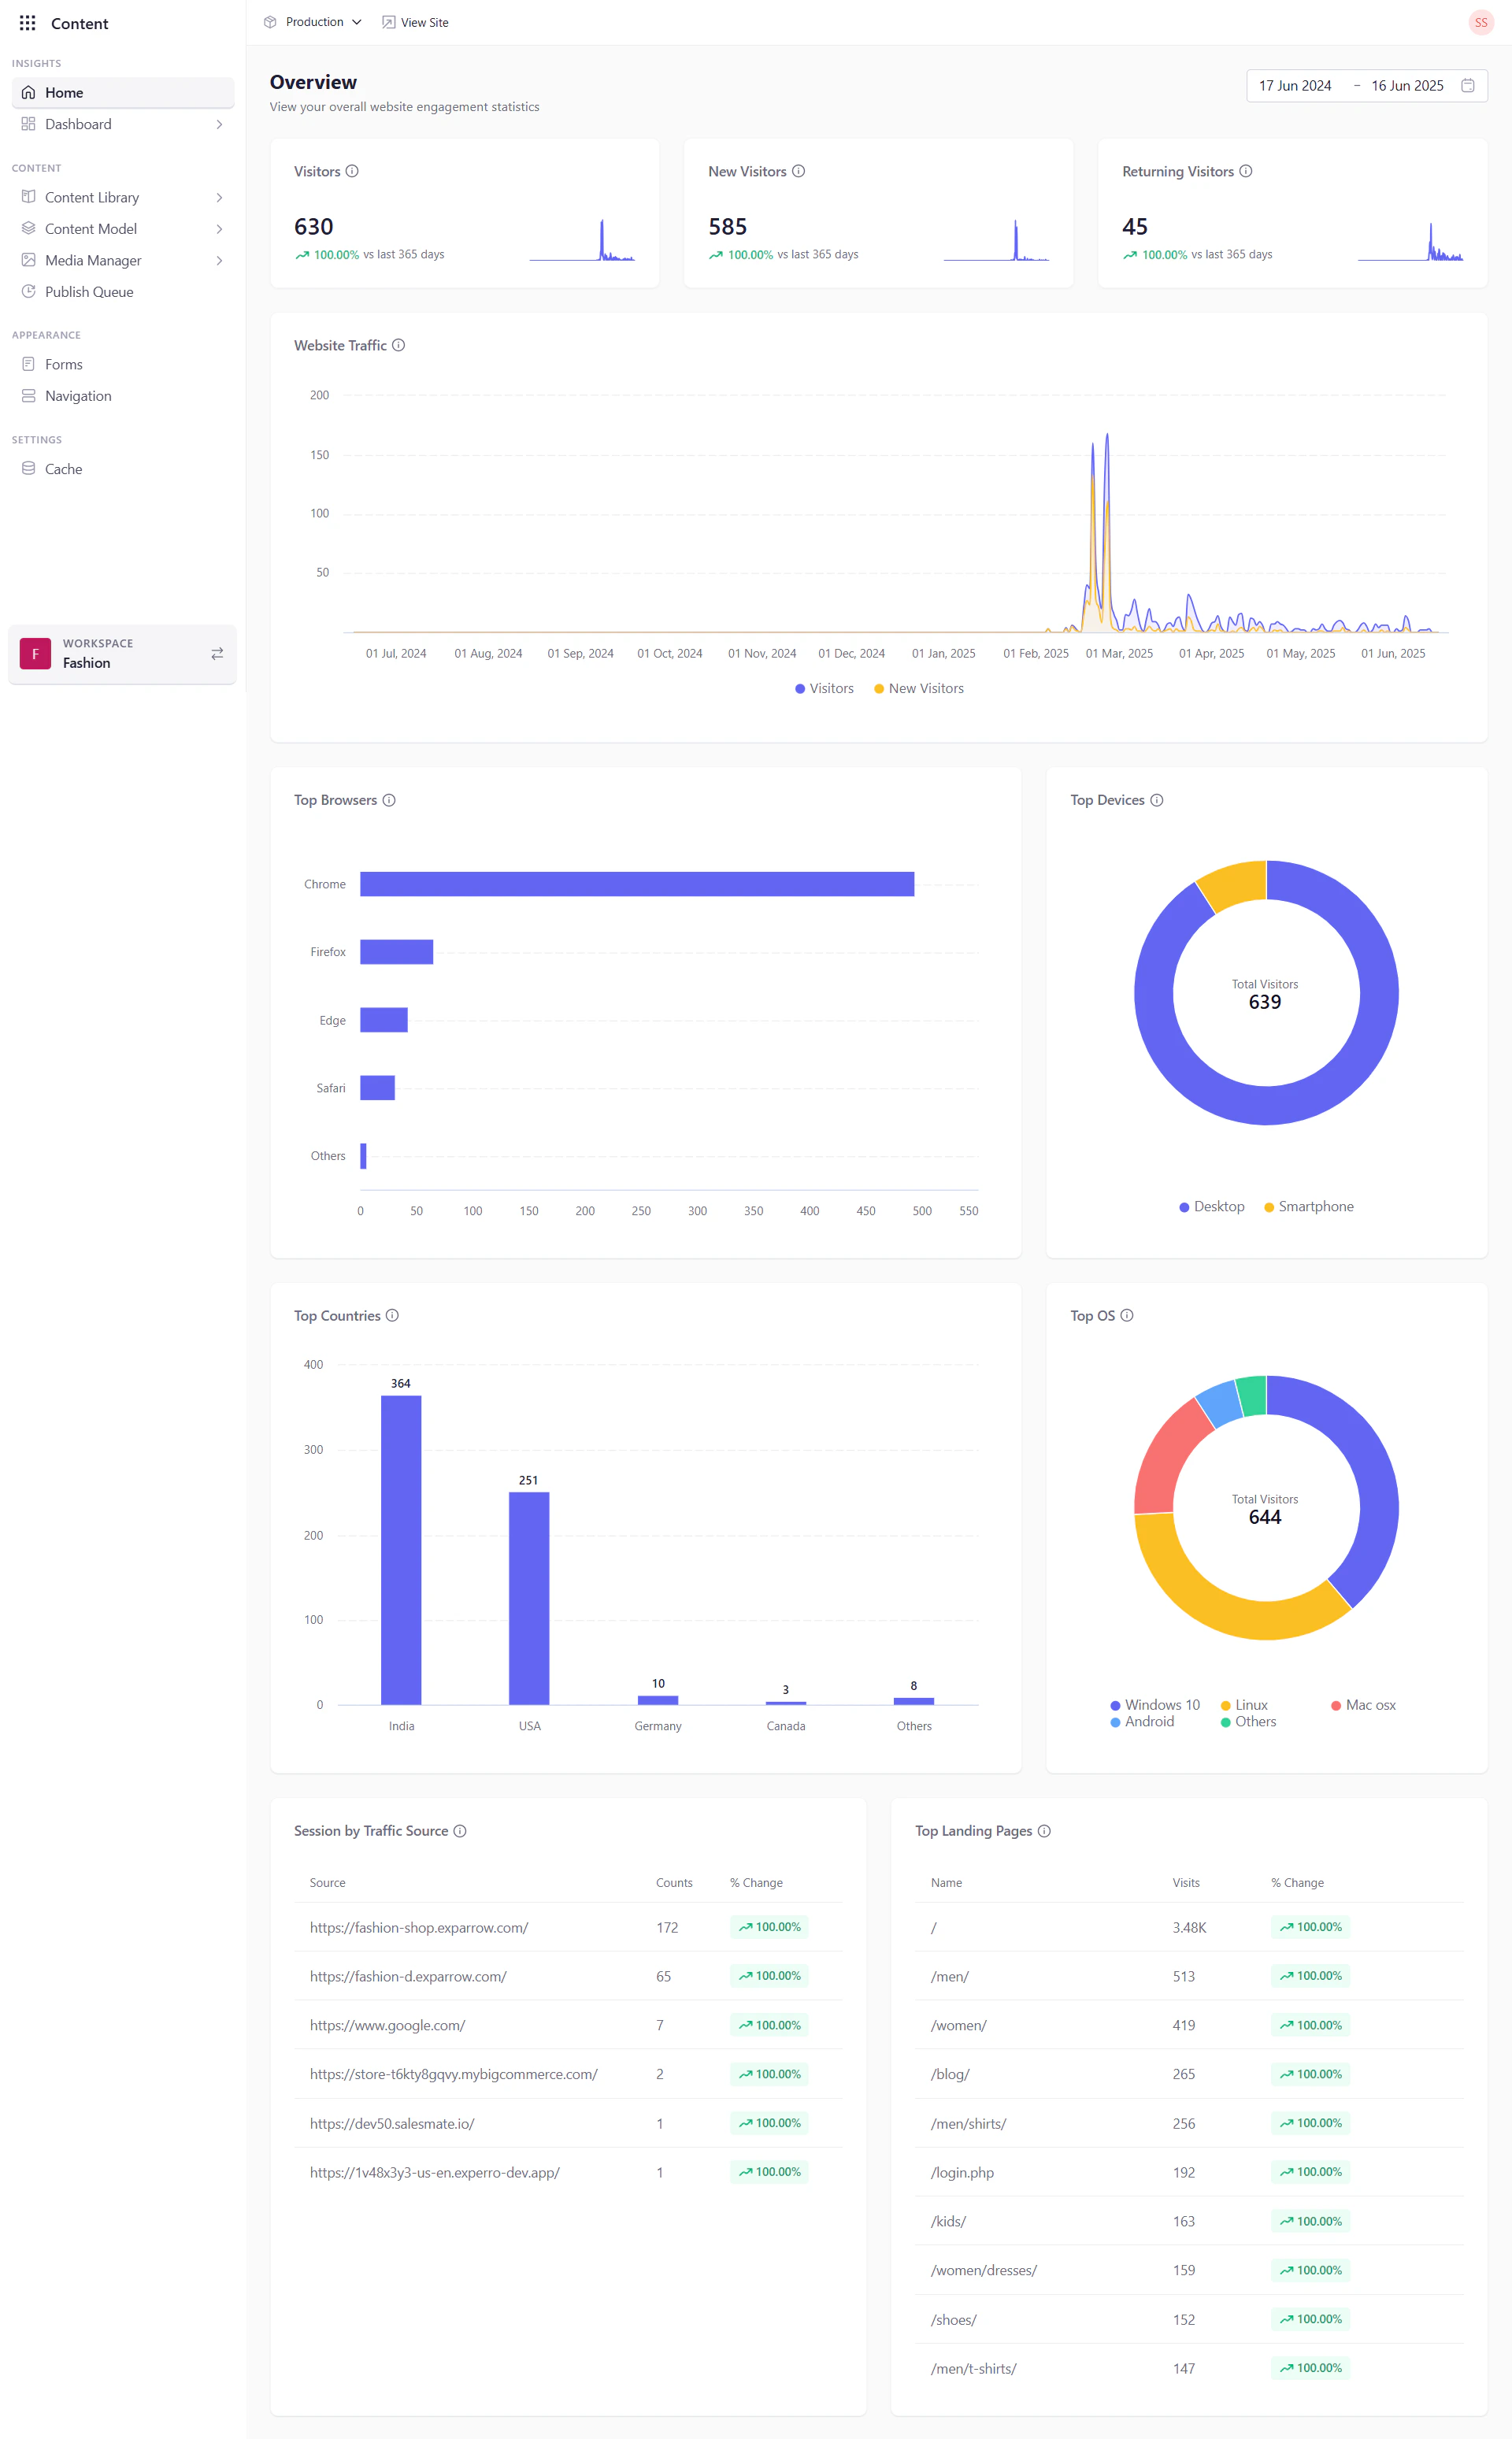
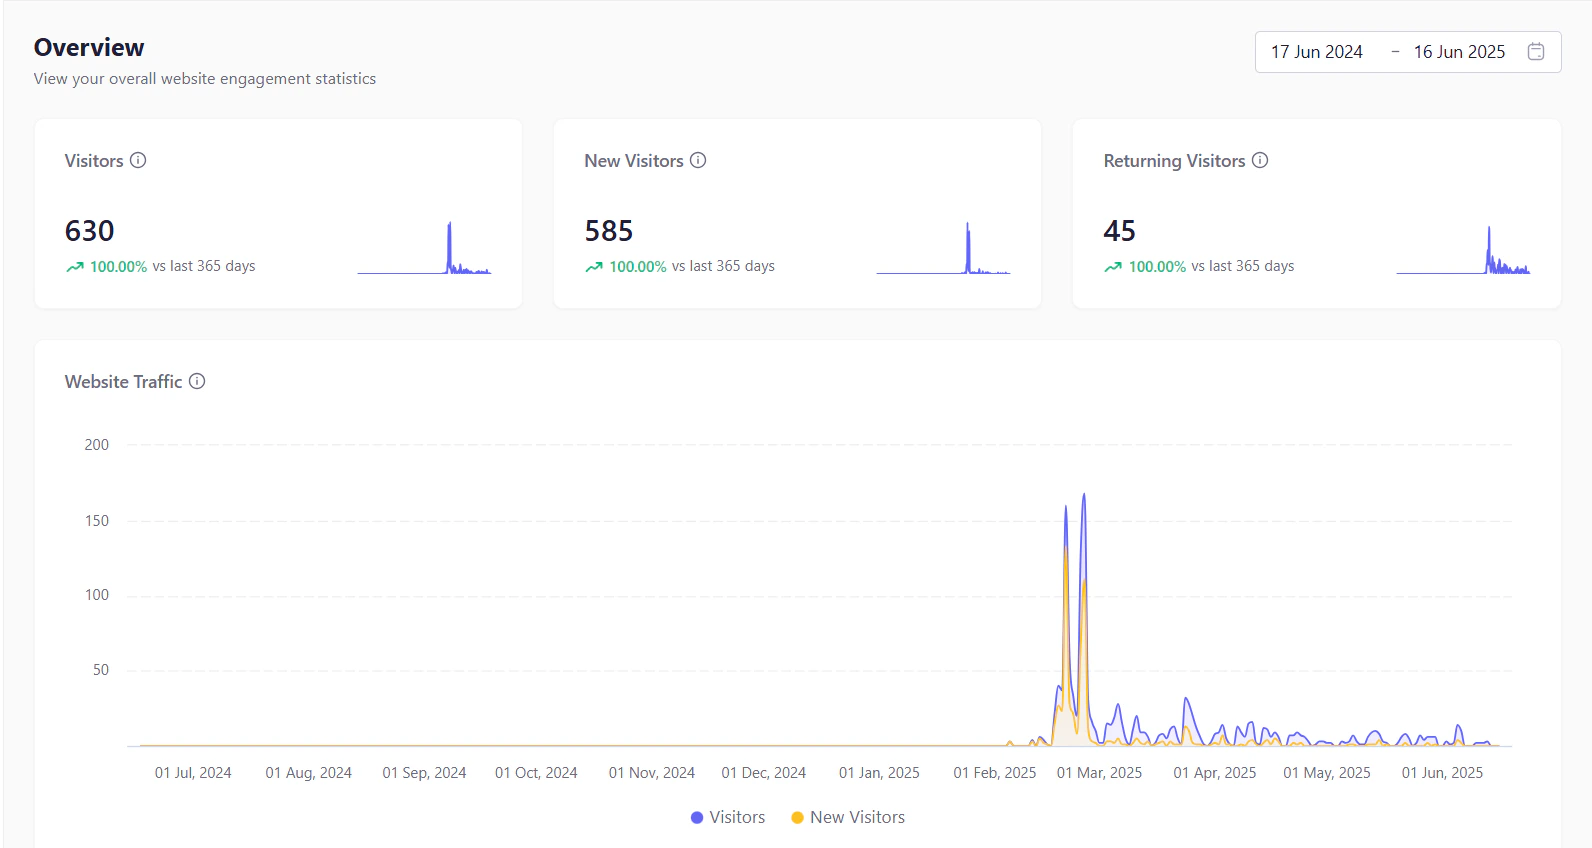
- Visitors: Total number of users who visited your website during the selected time frame.
- New Visitors: Number of users who accessed your site for the first time.
- Returning Visitors: Number of users who had visited before and came back within the selected period.
- Website Traffic: This displays all the traffic on your website in selected duration.
Audience Segmentation

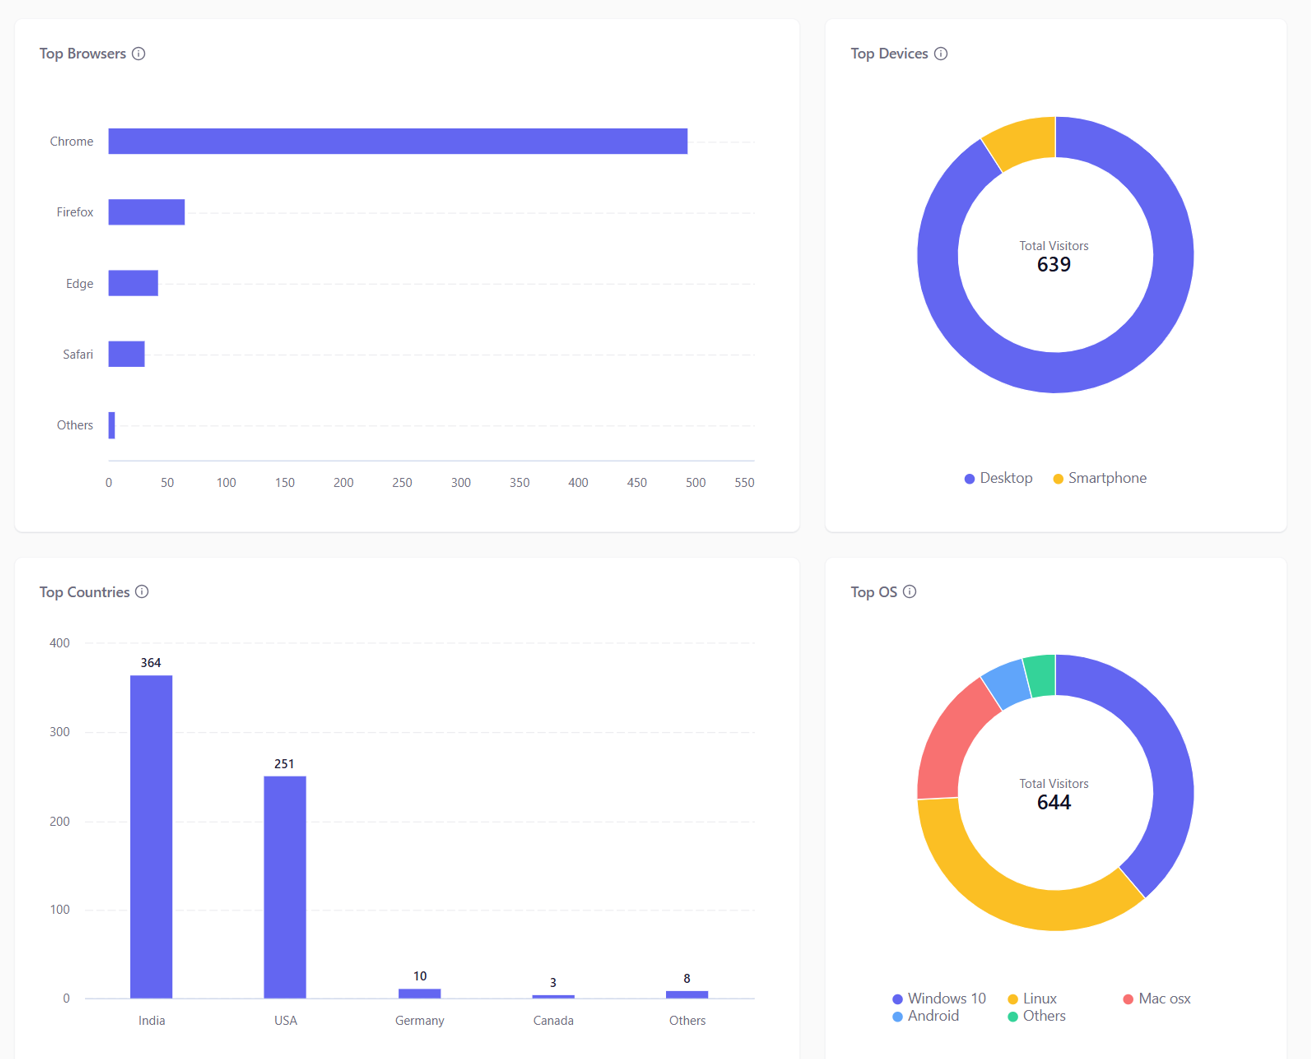
- Top Browsers: Breakdown of your traffic by browser (e.g., Chrome, Firefox, Safari). Helps you prioritize browser‑specific testing or feature support.
- Top Devices: Distribution of sessions across device types (e.g., Desktop, Smartphone ). Offers insight into which device to optimize for.
- Top Countries: Geographic distribution of your visitors, showing the top countries by session volume. Useful for localization and geo‑targeted content.
- Top Operating Systems: Shows which OS platforms (Windows, macOS, Android, iOS, etc.) your audience uses most.
Traffic Sources & Entry Points
- Sessions by Traffic Source: A grid view of where your visitors came from. Identify where the most visitors came from based on the source. Use this to gauge the effectiveness of acquisition channels.
- Top Landing Pages: Lists the URLs or content entries that received the highest number of first‑touch visits. Identifies your most compelling entry‑point content.