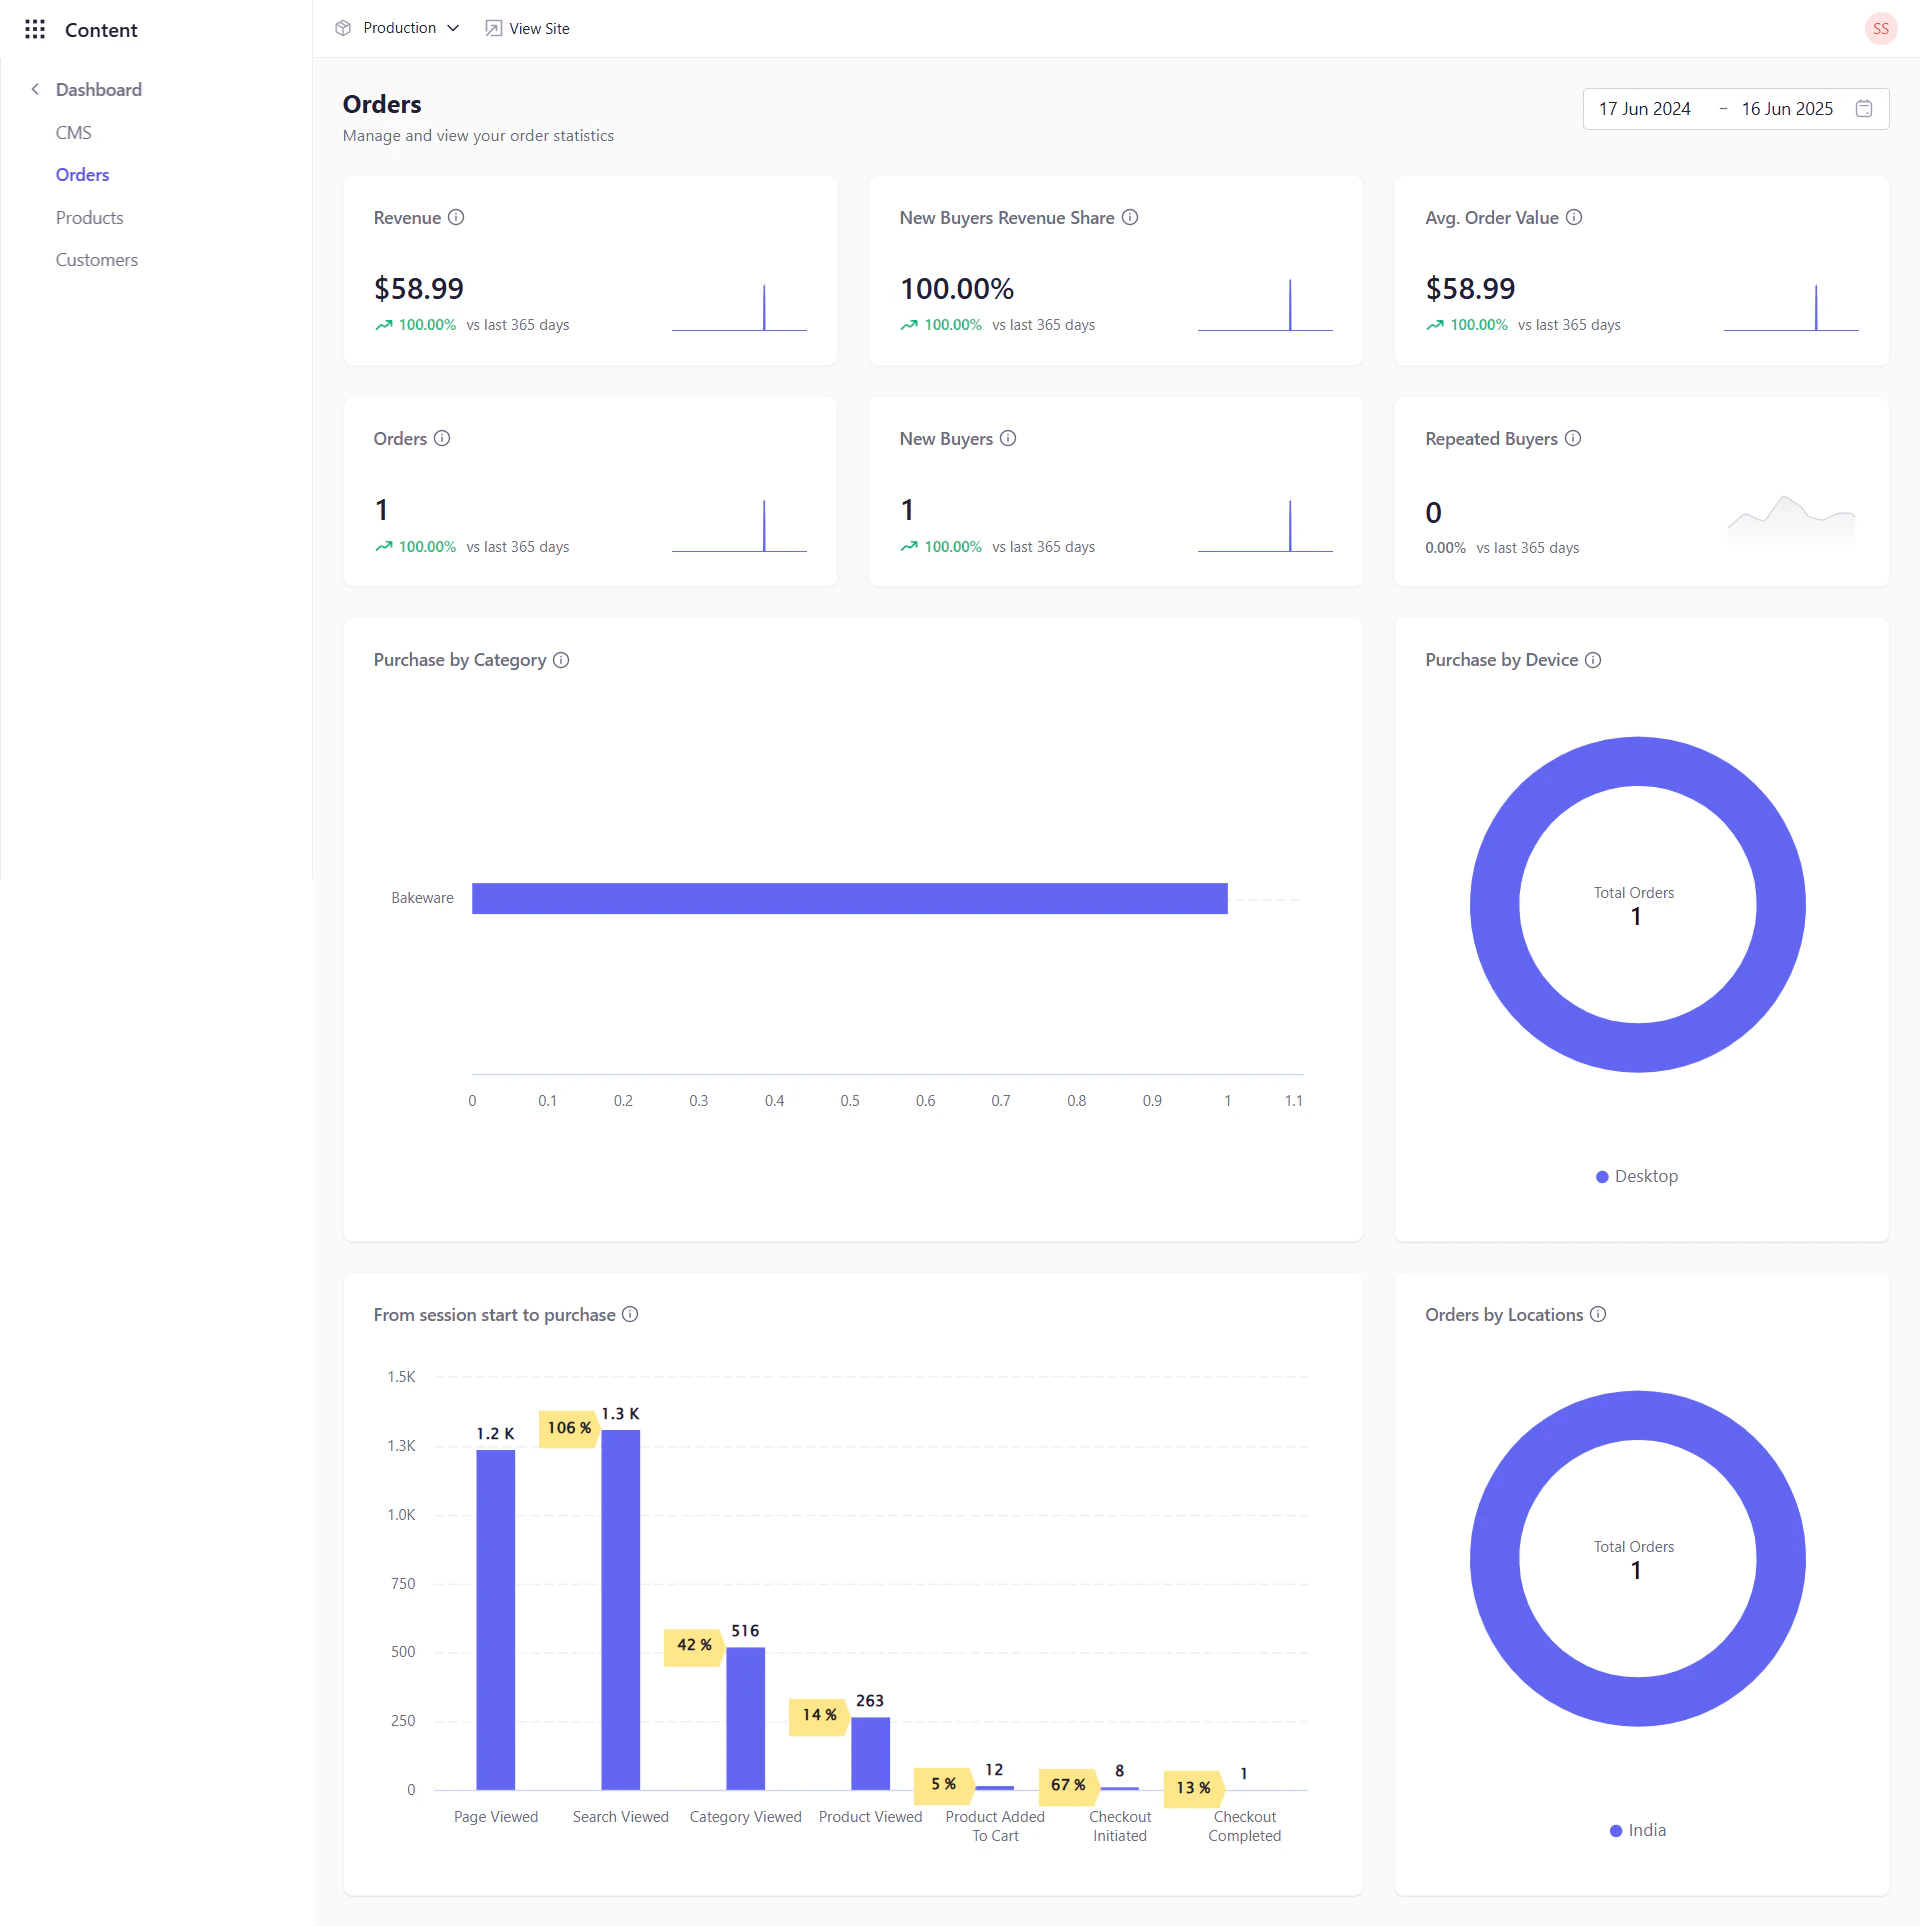
Revenue Metrics
- Revenue: Displays the total sales revenue generated during the selected timeframe.
- New Buyers Revenue Share: Shows the percentage of total revenue attributed to first‑time buyers.
- Avg. Order Value: Calculates the average order value for the selected period.
Buyer Segmentation
- Orders: Counts the total number of orders placed in the selected duration.
- New Buyers: Indicates how many distinct customers made their first purchase during the timeframe.
- Repeated Buyers: Reflects the number of returning customers who placed at least one repeat order in that period.
Behavioral Insights
- Purchase by Category: Breaks down orders by product category (e.g., Apparel, Electronics), helping you identify your top‑performing segments.
- Purchase by Device: Shows which device types (Desktop, Mobile, Tablet) were used to place orders, guiding UX and checkout optimizations.
- From Session Start to Purchase: Tracks the average number of sessions for various user events starting from ‘Page Viewed’ to ‘Checkout Completed’, highlighting purchase funnels and potential friction points.
Geographic Trends
- Orders by Location: Maps or tabulates order volume by country or region, so you can tailor marketing, shipping, and localization strategies to your highest‑value markets.